GLG410/598--Computers in Earth and Space Exploration
Lecture 17: Basic features in ArcMap--Shapefiles
So far, we have mostly worked with rasters. Now, we want to start talking about bringing vectors into ArcGIS. This means for now points, lines (including polylines which have vertices), and polygons. The simplest way to do this in ArcMap is as a Shapefile. For today's demonstration, we are going to digitize the faults.
Steps:
- Launch ArcMap and load whatever file you will be tracing over. Use this file if you need it: Carrizo_ActiveBreaksDSmall1.img
- Brainstorm a bit: what do we want in terms of lines and points and what attributes should we have?
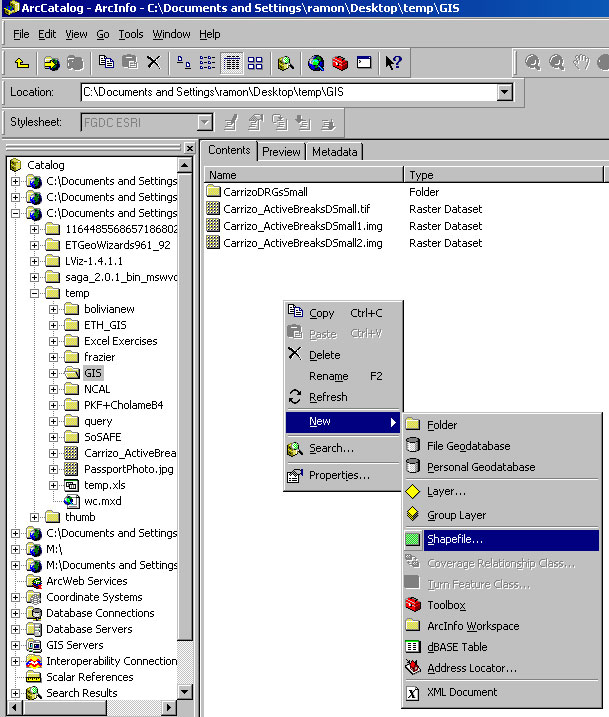
- Launch ArcCatalogue
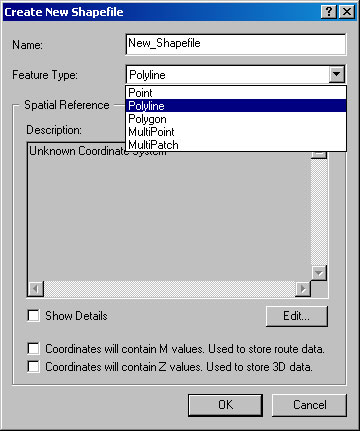
- Navigate to the directory where the image file is and click on new->Shapefile. You want to make a Polyline. Name the file something meaningful and then say ok.
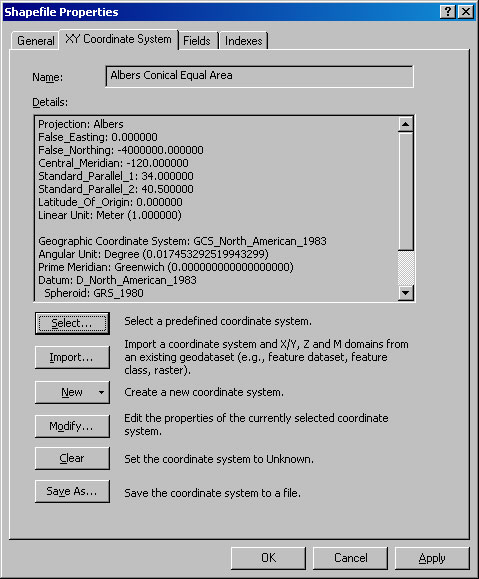
- Inside of ArcCatalogue, right click on the shapefile and select properties. Then choose the XY Coordinate System tab. You can Select... a coordinate system, or import one. I tend to import the one that the base image is from. Just click on import and navigate to that file and then say Add. ArcCatalogue will read the header file and define the coordinate system for you. Push ok.
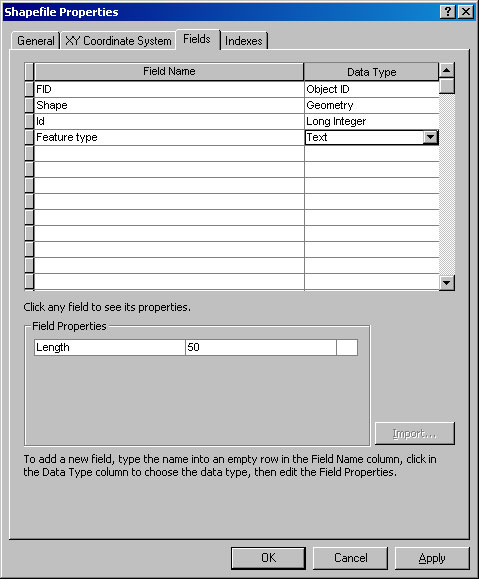
- Inside of ArcCatalogue, right click on the shapefile and select properties. This time, choose the Fields Tab. Click in the field name and type Feature type. You can call it anything ("faults" example). Under Data Type, make sure it is text. Note you could have various number types as well. ArcCatalogue will prompt you to shorten the Field Name possibly.
- In ArcMap, add the new shapefile to your project (click on the plus with the yellow around it).
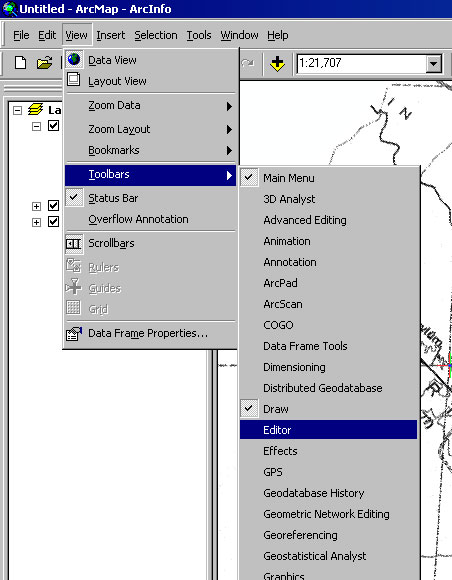
- Under the view menu in ArcMap, add the Editor toolbar:
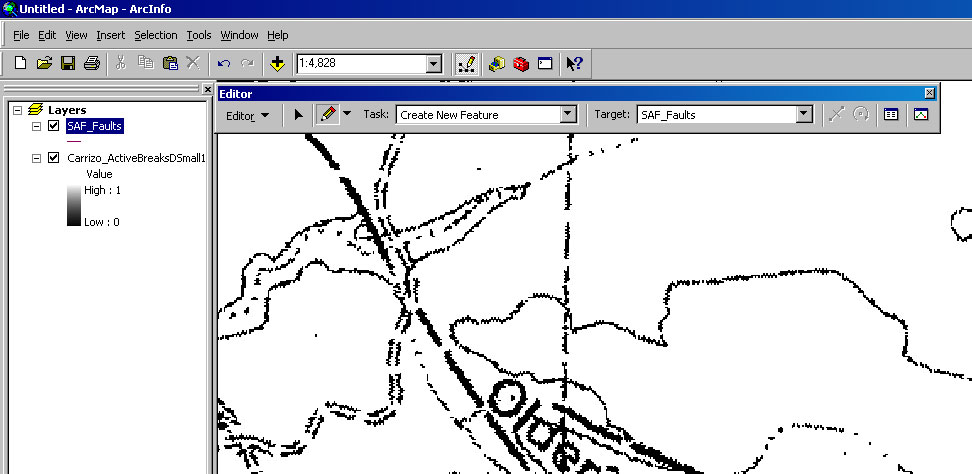
- In the Editor tool bar's first left hand menu, pull down and select, Start Editing. Make sure the target is the Shapefile that you just made. You can zoom around with the standard tools, but then when you are in close to one of the faults, click on the little pencil tool to start to Create a New Feature:
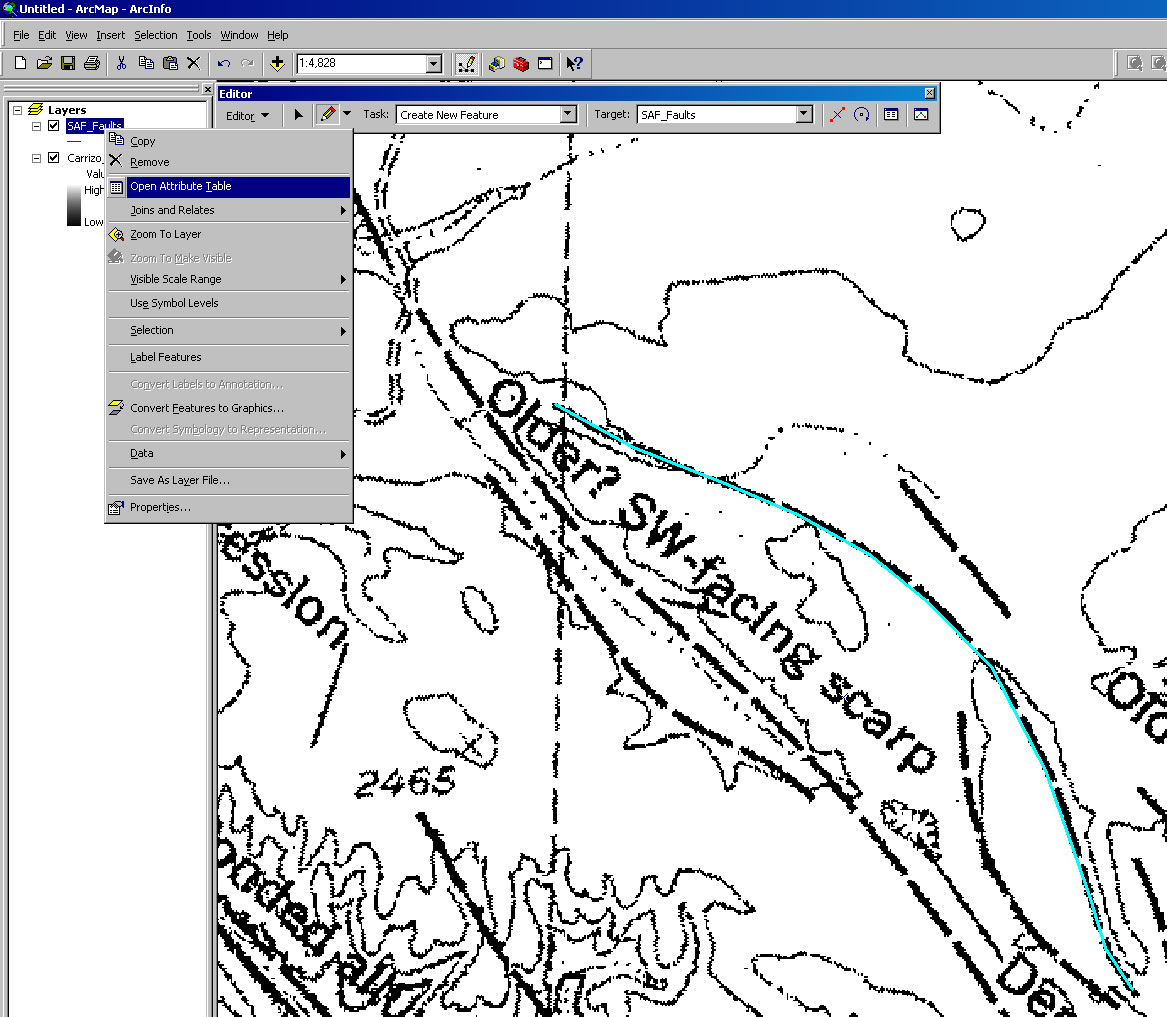
- Click to add each vertex, and double click to end the line.
- Open the attribute table for the shapefile by right clicking on it under the layer control:
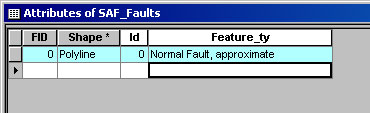
- In the attribute table, you can edit the Feature type field and type in what the feature is ("Normal Fault, approximate")--Make sure you always use the same way of writing each feature, down to using the exact same spelling!
- Continue clicking out the features for a while, filling out the Attribute table as you go. When you are ready to stop, click on the Editor toolbar menu and choose Stop editing.
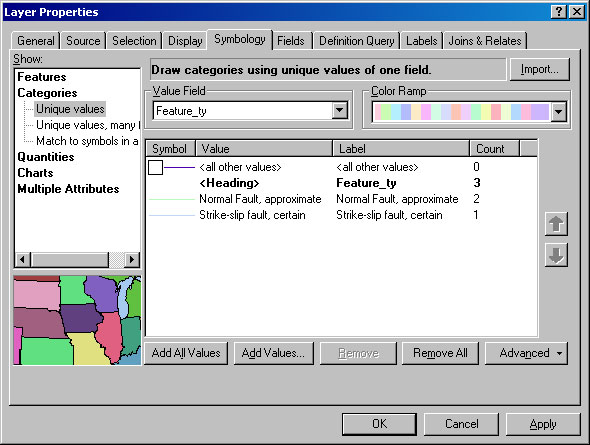
- To symbolize the lines you just drew, right click on the layer in the Layer Control/Table of Contents and choose Properties->Symbology. Then on the left, select Categories. For Value Field, choose Feature Type, and then Add all Values. Unselect the Value.
- Now, double click on the symbol and go to find the appropriate one: On the lower right, select more symbols and highlight Geology 24k:
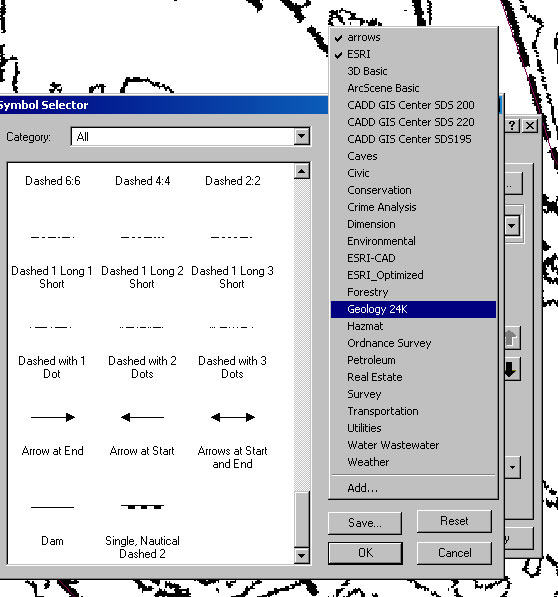
- Navigate until you find the symbol you want.
- You can also label them if you want (right click on the file under layer control->Label Features.
You can do this again, but make it a point shapefile this time and mark the locations of spot observations.
Last modified: April 7, 2009