if/elseif/else

Execute statements if condition is true
Syntax
if expression
   statements
elseif expression
   statements
else
   statements
end
Description
if expression, statements, end evaluates an expression, and
executes a group of statements when the expression is true.

elseif and else are optional, and execute statements only when
previous expressions in the if block are false.
An if block can include multiple elseif statements.
Example 1
>> a = 1;
>> if a==1
disp('Hello World')
end

Hello World
Example 2
>> b = 10;
>> if b == 10
disp('Value is exactly 10')
else
disp('Value is not 10, try again')
end

Value is exactly 10
>> b = 5;
>> if b == 10
disp('Value is exactly 10')
else
disp('Value is not 10, try again')
end

Value is not 10, try again
Example 3
Here is a sample script which demonstrates more complex flow control.
X=ones(10);

if length(X)>500
    disp('That is a long vector')
elseif length(X)==1
    X=ones(500);
    fprintf('I made your vector %d elements long\n',length(X))
else
    disp('Your vector is sufficiently long')
end
Video explanation:
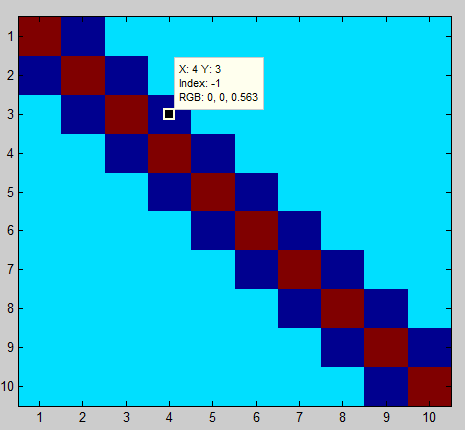
Example 4
This example for IF statements and For loops comes directly from the Matlab documentation on IF.
% Preallocate a matrix
nrows = 10;
ncols = 10;
myData = ones(nrows, ncols);

% Loop through the matrix
for r = 1:nrows
   for c = 1:ncols

      if r == c
         myData(r,c) = 2;
      elseif abs(r - c) == 1
         myData(r,c) = -1;
      else
         myData(r,c) = 0;
      end

   end
end

imagesc(myData)
Video explanation:
Example applied to Yellowstone Earthquakes
This example applies to a question from last class: How to control plotting of text.
       if length(locations)~=0
            s = sprintf('%2.1f',mean_depth);
            text(long, lat, s);
       end
Build a web page for this assignment that contains the following:
A plot of magnitude versus time. What does it show? Note that the time is decimal days from the beginning of 2011.
(3D Plot) Plot 3D locations of earthquakes. Choose a good view orientation
For 3 different resolutions (stepsize = 0.5, 1, and 2 degrees)):
(Grid Plot) Plot blue circles at each point in the grid on top of earthquake locations
(Text Label Plot) Plot text labels for mean depths on top of earthquake locations. Use the IF statement so we don't see NaN plotted!
(Scaled Image Plot) Plot scaled image (imagesc or pcolor) of mean depths below earthquake locations
A link to your M-files (Matlab script and functions) used to make these plots
Discussion: How does this seismicity pattern demonstrate the behavior of the subduction zone earthquakes: what is their time variationand what is the geometry of the seismicity cloud? How does that geometry relate to the tectonic setting?