Lecture 21: Compiling geologic field data in ArcMap
This exercise will use geologic mapping data gathered at Dreamy Draw in the Phoenix Mountains and compile it into ArcMap. We also have downloaded high quality color aerial photography as base maps from the US Geological Survey Seamless site. Following below are the basemap (zipped) that was used and an Excel file with some strike and dip data.
The shape files (right-click and 'save target as'):
Download these files, put them into a new folder and unzip them.
How to get a Excel spread sheet (e.g. strike and dip measurements) into ArcMap
Assume you have measurements of strike and dip or any other spatially referenced (i.e. has geographic coordinates) data and want to import them
into ArcMap to overlie them with other data. Following, we briefly show you how to get point observations from an Excel spread sheet (*.xls)
into ArcMap.
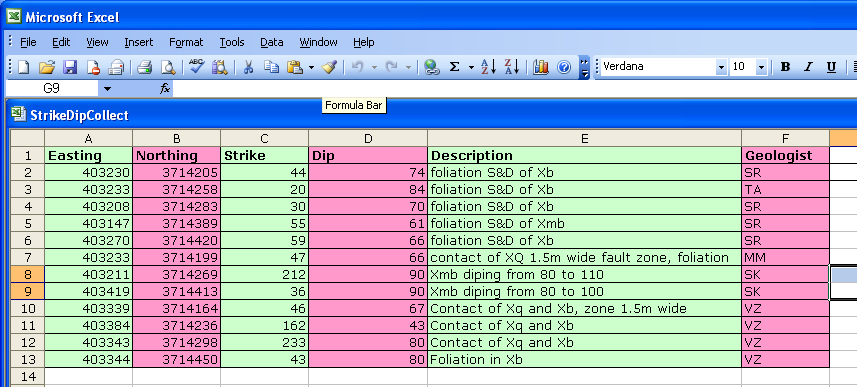
The following link contains some of the strike and dip values of foliation you have measured in the field. Please right-click and download the file.
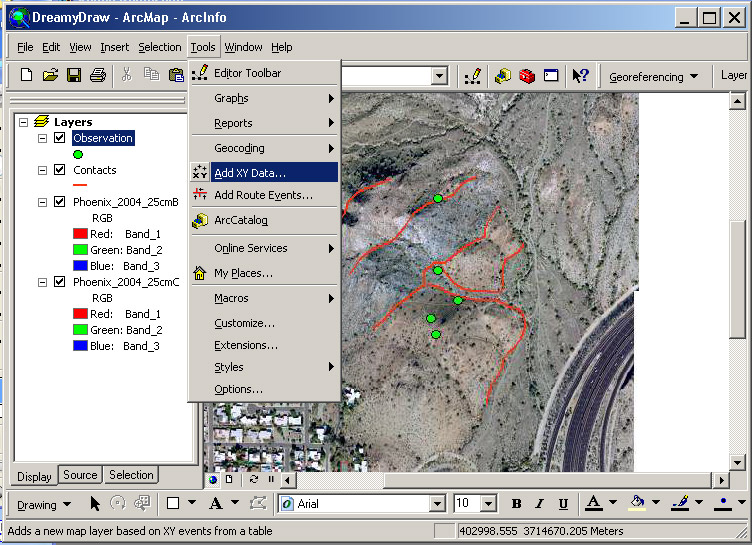
If you haven't opened the Dreamy Draw *.mxd file at this point please do so. You should see the following screen.
To add the spread sheet, go to Tools => Add XY Data. Here you can browse to the *.xls file you downloaded (StrikeDipColl.xls).
You will have to specify the x-field ( =Easting) and th y-field ( =Northing). You will also have to define the coordinate system. As you may
rememeber all the GPS that we had in the field were on UTM Zone 12N, NAD 1983. That is the same coordinate system that the Dreamy Draw project
is projected in. Thus, in the Add XY Data, under Coordinate System of Input Coordinates you can go to Edit.... Here you
go to Import and select one of the shape files in your project (e.g. Contacts.shp).
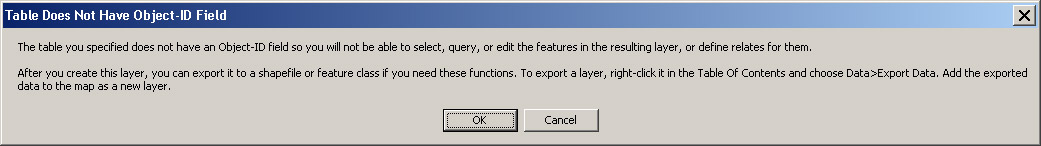
Now you can pres OK and add the data. You will probably get an error message:
Video explanation:
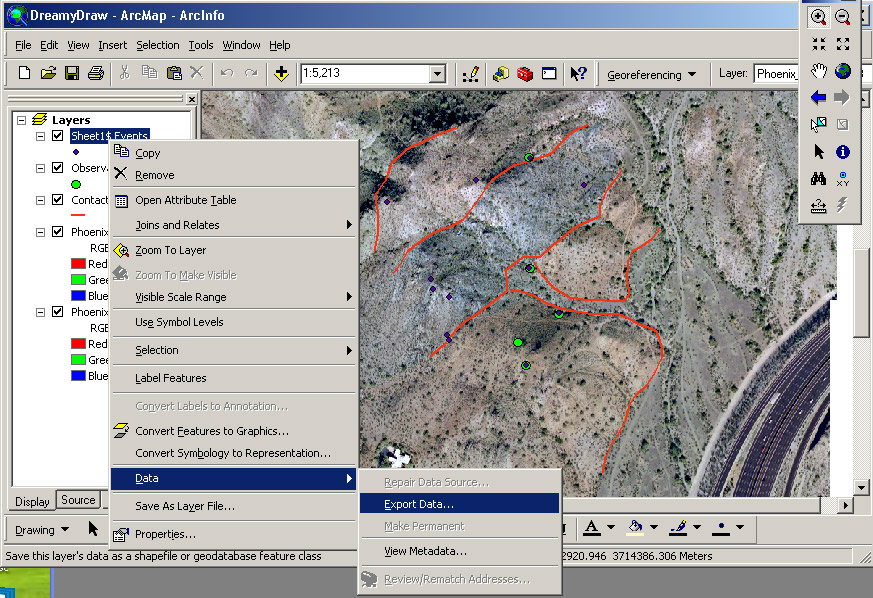
Read the instruction, press OK and follow it => Select and right-click the imported layer. Go to Data
and press Export Data.
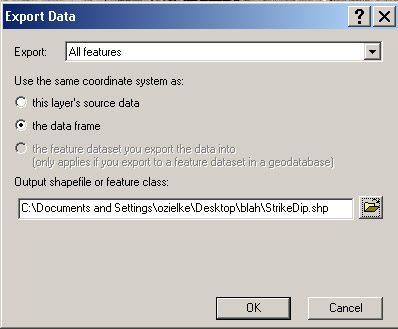
Make sure that, when asked what coordinate system to use, you select the data frame. Type in a name
for the output file (which will be a shape file) and press ok.
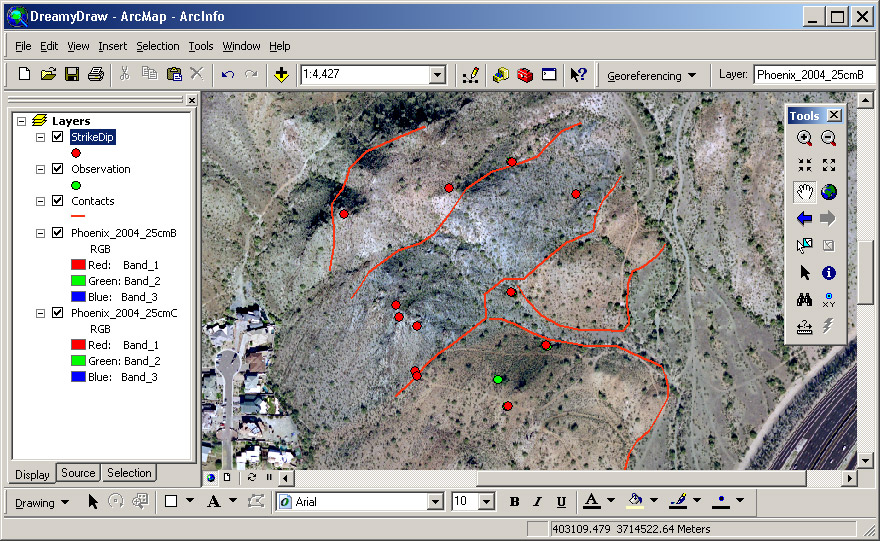
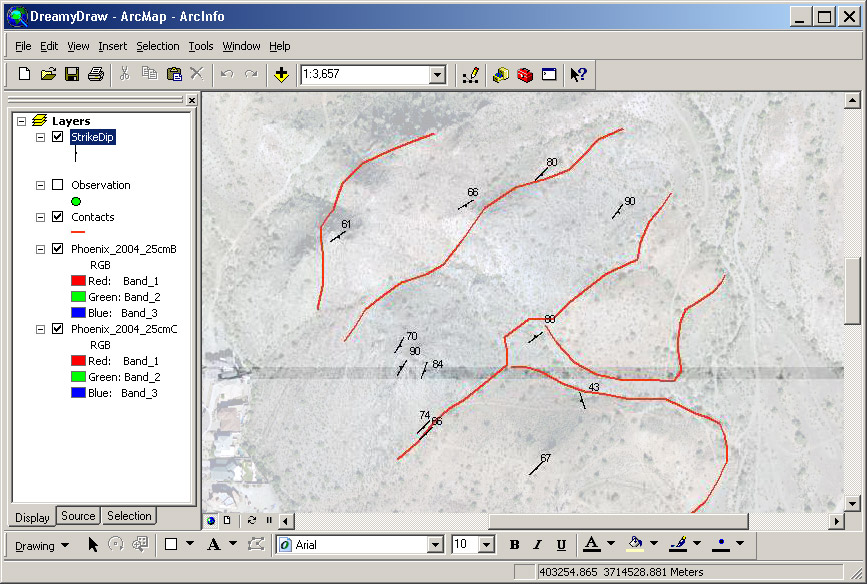
When the new shape file is made you can add it (if not already done) and remove the raw data. The image below
shows the position where strike and dip of foliation was measured.
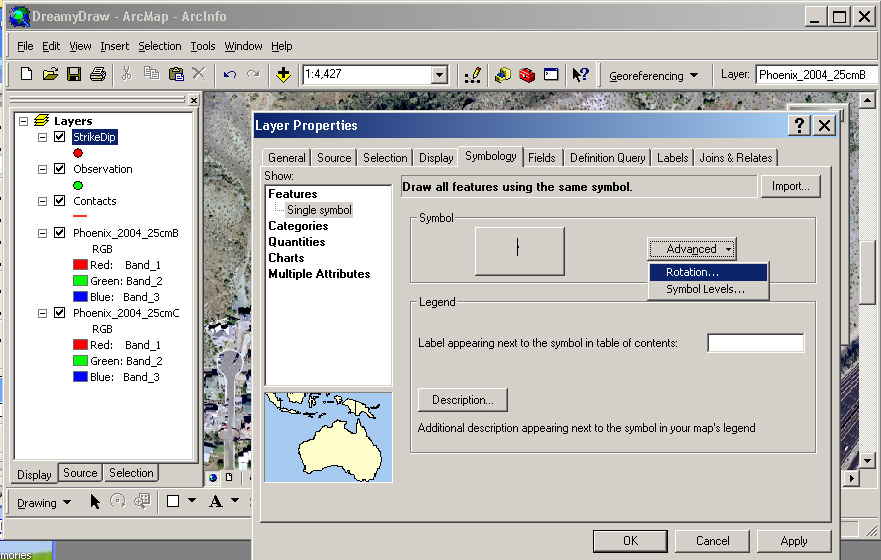
Although knowing the position is nice, it would be more interesting to show the actual strike and dip direction.
For that, go to the layer properties and then symbology. Under symbol you can go to more symbols and
select the Geology 24k. Now, pick the proper sign. under advanced you can apply a rotation to the symbol.
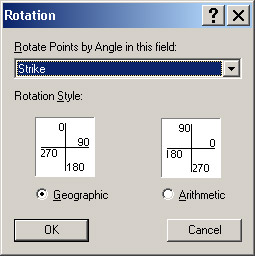
Pick the Strike as the rotation angle and press ok.
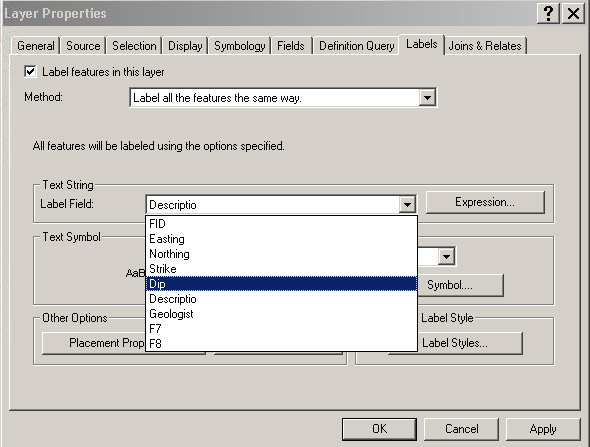
Now you can see the orientation and dip direction of the foliation at each position. But you would probably also want to see the dip value. Go to
the layer properties again and select label. Check the box that ask you whether you want to label features in this layer.
Under String Text you define what label you want to put on the symbol. In our case we can to label with Dip. Press OK.