Query and processing of vector data with application to Arizona seismic hazard
You have now learned the basics of creating and working with both rasters and vectors in ArcMap. In this exercise, we want to give you a chance to work with some vector data to do some queries and other processing to answer an earth science question. In this case, the example will come from Arizona and its earthquake hazards (overall and then for Scottsdale in particular).
Step 1: Gather the data
For this exercise, you will need the following data:
Arizona digital elevation model and Arizona geologic map (these are in this demo from an earlier lecture: GIS_DEM.zip. Just download it, uncompress it, and open the project file (AZ_GIS9.0.mxd). You can add everything else to it.
Arizona municipalities and transportation infrastructure. Download these (and lots of other interesting things) here: http://issrweb.asu.edu/research_services/gis/data--This is the ASU GIS lab data portal. Note you will have to enter->Administration boundaries->download->Urbanized areas or under Transportation, you want State Routes, Interstates, and Railways. We have already done this for you (but you should look around that site and see what else interesting you can find).
Arizona active faults from the USGS Quaternary faults data base: We have already downloaded, clipped to the Arizona Faults, and projected these data for you. Please use this file: AZQFaults.zip.
If you need these data for other projects, go to http://earthquake.usgs.gov/regional/qfaults/. Look for the shapefile link in the upper middle of the screen. Have a look at the readme in that directory, and download the qfaultsshapefiles.zip. Once you unzip it, you will see that there are two shapefiles in side it: QuaternaryFaults.shp and faultareas.shp. You should study the contents of the directory. For best results, you should project the QuaternaryFaults.shp to the coordinate system of the other files in your project.
Symbolize all of these features appropriately
Step 2: query the shapefiles
In this example, you are learning how to find certain features in the shapefiles that satisfy a given query.
Find Greater Phoenix's outline
The urban boundaries are in the urban.shp that you downloaded above.
Zoom into greater Phoenix and identify with the identify tool. Look also at the attribute table for the urban.shp shapefile.
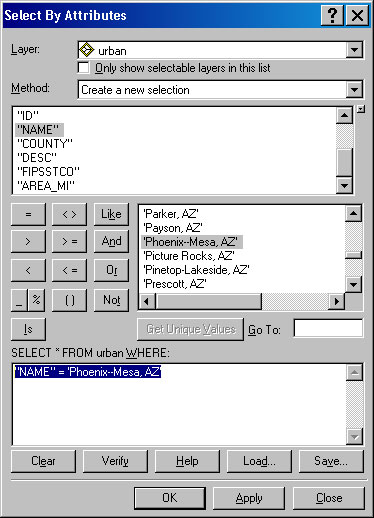
Go to the menu: Selection->Select by attributes. Then choose the urban.shp as your layer to query. Click on "NAME" and then "Get Unique Values"--This just will make it easier for us to know what we are looking for. Double click on "Name" and then click "=" and then look for 'Phoenix--Mesa, AZ'. Now we have built the query which will select from urban.shp where "NAME" = 'Phoenix--Mesa, AZ'. Click on Ok.
You will see all of the features that satisfy that query highlighted.
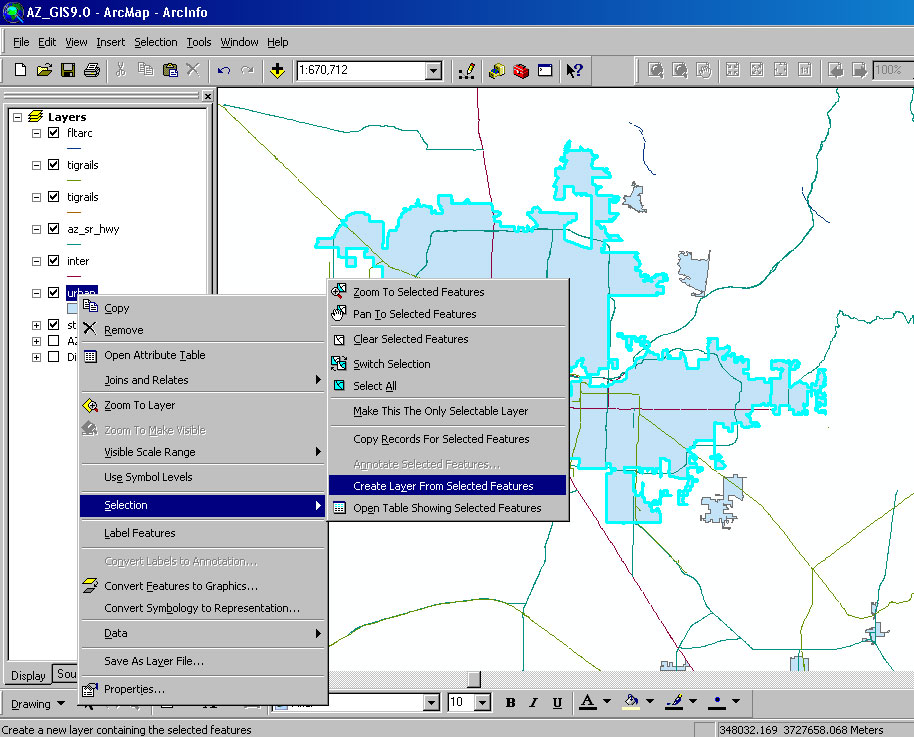
Under the layer control, right click on urban.shp: Selection->create layer from features.
Save the resulting selection as a new shapefile. Right click on urban selection in the layer control: Data->Export data. Save it accordingly And yes, you do want to add the exported shapefile as a layer to your current project.
Video explanation:
Step 3: compute a buffer around your selection
The new national earthquake hazard standards say that any active faults within 50 and also 100 km have to be accounted for. A buffer is a zone around a map feature measured in units of distance or time.
Compute a 50 km buffer around greater Phoenix
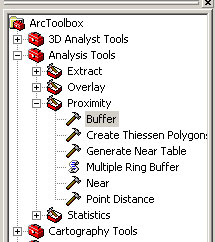
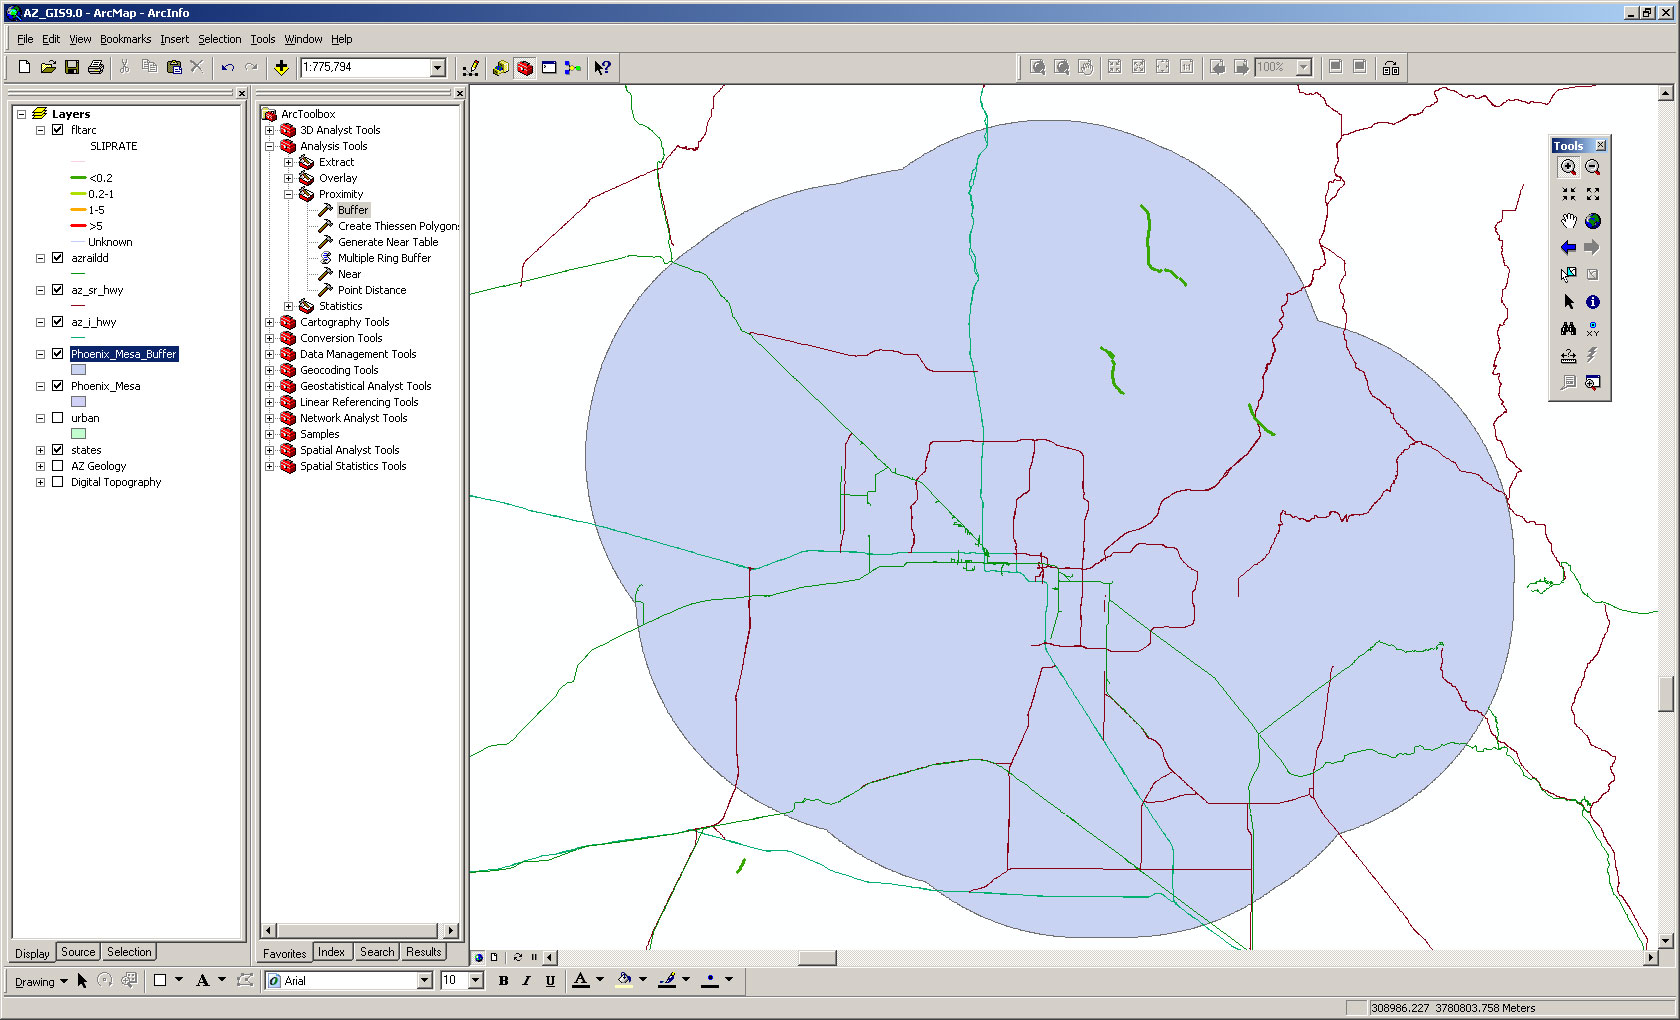
You will compute the buffer from inside of ArcToolbox: Analysis Tools->Proximity->Buffer.
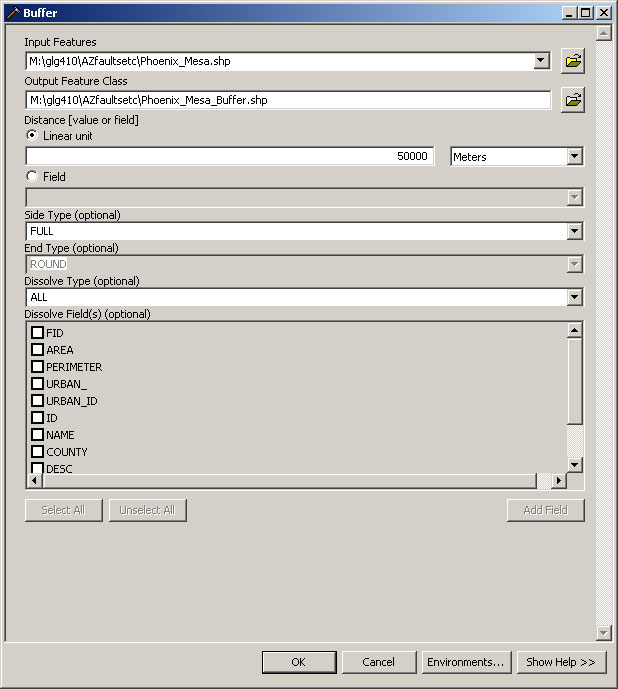
Input Features will be the selected Phoenix_Mesa area from step above
Defaults for the output feature class will usually be good unless you do it more than once. Arc may not like to overwrite a pre-exisiting file so just give it a different name.
Type the distance in map units to create a buffer area around the feature: Linear unit = 50000 meters
Make sure to chose to Dissolve All so that you will get the composite buffer around the entire selected object(s).
A buffer is created at the specified distance.
Video explanation:
Step 4: query to find what features are inside of another polygon
Now that we have the 50 km polygon, you can query the faults shapefile to find all the faults that are inside of it.
Which faults are inside the 50 km buffer around greater Phoenix?
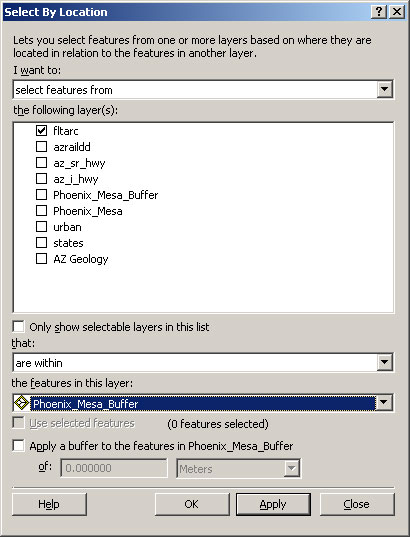
Menu Selection->Select by location. In the resulting dialogue screen, you want to Select features fromfltarc.shp (or AZQFaults.shp depending on what you call it) that are contained by the features in this layer: Phoenix_Mesa_Buffer.shp. Push ok.
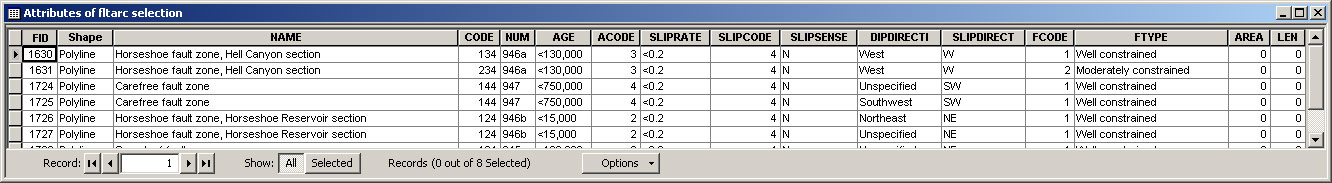
Create a layer from the selected features, and there we have a tabular report of the faults in 50 km of Phoenix and Mesa. You can also make a nice map to go with it (PHXMESAFaults50km.pdf).
Video explanation:
Application to study of all of Arizona's active faults
In this case, we want to find all of the geologic units in Arizona that are Quaternary age and compare them with the active faults.
Knowing what you know above, this is pretty easy. It just uses a big query on the Geologic map.
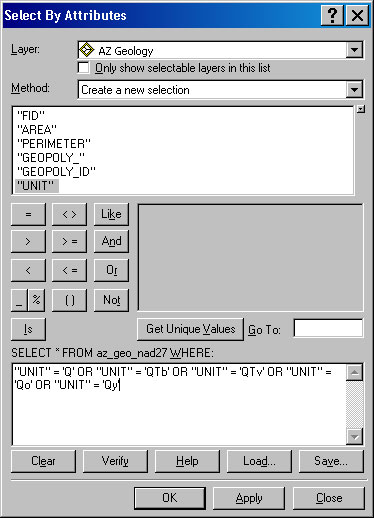
In the menu: Selection->Select by attributes, Select from AZ Geology. Click on Units and "Get Unique Values". Then sequentially click on "UNIT" = unit of interest OR and repeat until you have everything that has a "Q" in it: "UNIT" = 'Q' OR "UNIT" = 'QTb' OR "UNIT" = 'QTv' OR "UNIT" = 'Qo' OR "UNIT" = 'Qy'.
Click ok, perform the query (this may take a little while), and then as above, create a layer from the selected features; export the selection to a new shapefile and add it to the project.
Color the new shapefile of Quaternary units yellow and don't color the outlines (under symbology)
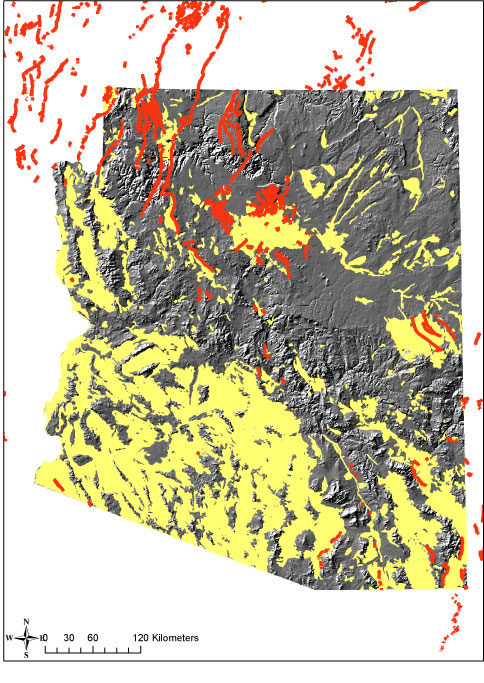
Now display the resulting map with the active faults in red over the Quaternary units in yellow over the shaded relief: AZfaultsQuat.pdf
Video explanation:
Exporting a layer's Attributes tables from ArcMap to Excel
Sometimes it is useful to have a layer's attributes in table form (e.g., if we want to further explore the data that go into a layer. This can easily be done as follows:
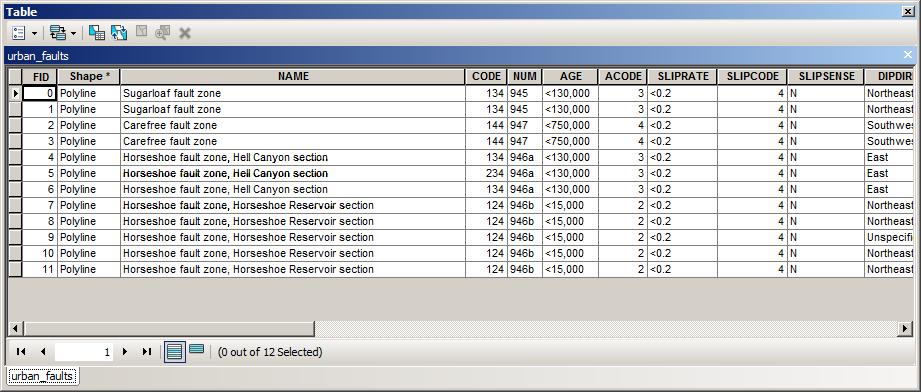
Right click the layer from the Table of Contents and select Open Attributes Table.
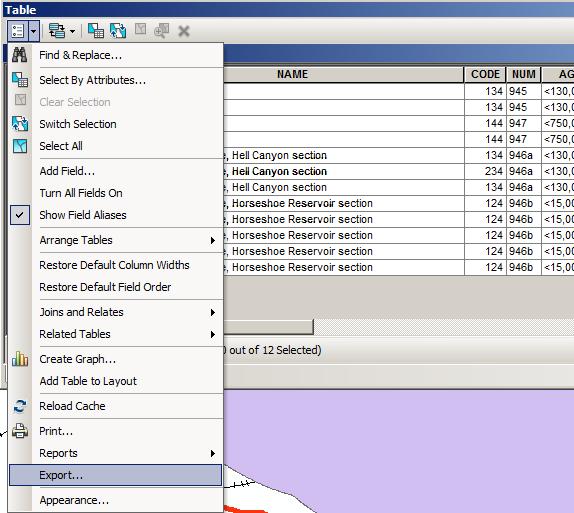
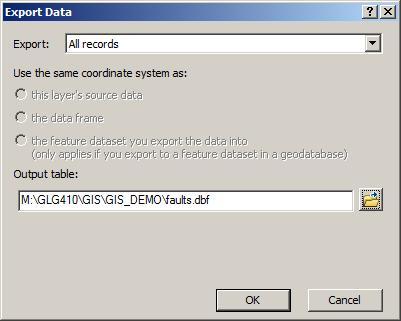
Click the Table Options button and then Export....