GLG410/598--Computers in Earth and Space Exploration
Lecture 4
Introduction
In this lecture, we will learn to create Matlab scripts ("M-files") that allow use to run a series of commands in a much quicker and easier way.
We will then use this new tool to demonstrate how we can take a set of data from an input file, import that data into Matlab, have Matlab plot the data, and finally save it as a JPEG image, all in "one motion".
The first part of this lecture is a demonstration of the usage and capabilities of scripting.
The second part of class will be an in-class assignment where you can learn this new skill by playing with a dataset of a recent earthquake swarm in Yellowstone National Park.
Matlab Scripting
The advantage of "scripting" vs. "command line" is that you can give Matlab hundreds to thousands of commands by just typing the name of your saved script.
Scripting in Matlab is done by using the Matlab Editor.
The Editor is Matlab's built-in text editor.
You will type the same kinds of commands that we have been typing on the command line.
You will want to keep one command per line!
You will also want to remember to end each line with a semicolon to suppress the output.
Matlab scripts are also called "M-files".
This is because they have the ".m" ending.
Matlab will recognize ALL files with ".m" as scripts to run commands.
To open the Editor window, click the icon at the top of the Matlab GUI  , or type edit.
We can type the last commands from Lecture 3 into the Editor.
We want to load the input file into Matlab, plot the river discharge data, add a title and axis labels, and then save the figure to a JPEG.
, or type edit.
We can type the last commands from Lecture 3 into the Editor.
We want to load the input file into Matlab, plot the river discharge data, add a title and axis labels, and then save the figure to a JPEG.
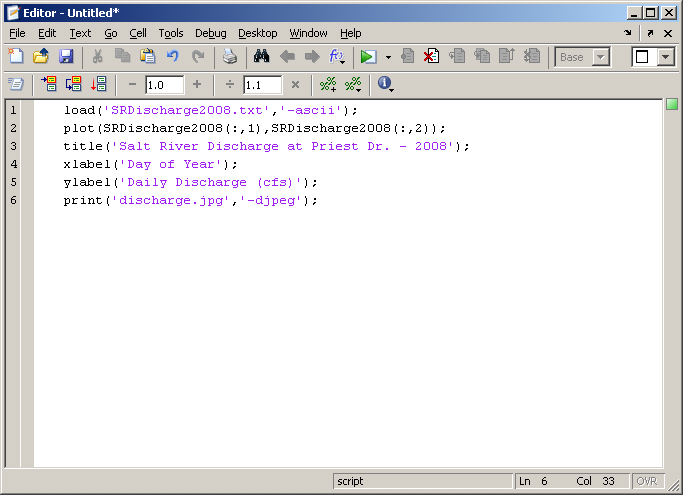
Save the script to an M-file. We can call this script daily_discharge.m. To run this script, type daily_discharge at the prompt in the Command Window.
Commenting
The above script is functional, but if we were to pass this off to another person, it would take them some time to figure out what the script does if they run it.
This is where commenting comes in VERY handy.
To place comments within a script that you write, you will use the percent sign, %.
All text in that line after % will turn green and will be a comment.
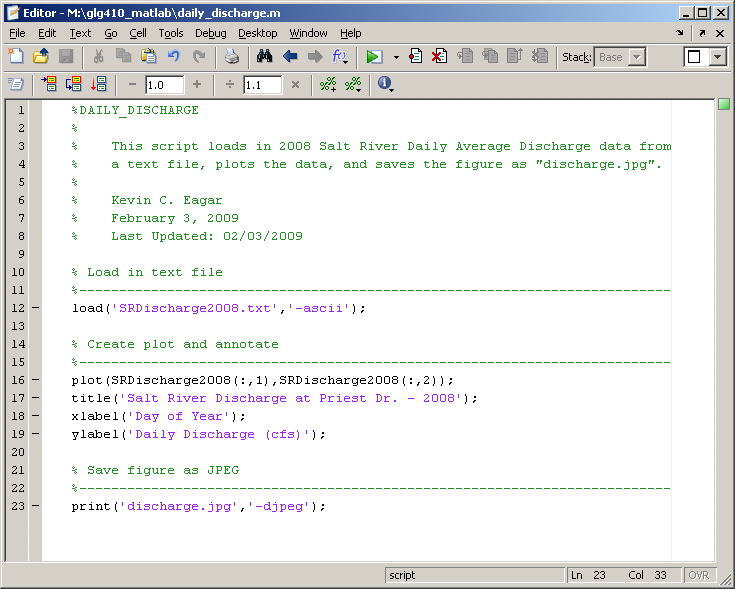
Here is that same script, but now it is properly commented.
Kevin's Tips For Proper Commenting
- Write your comments first, EVEN before you start writing the code/commands
- Header Section - This is at the very top of your script
- First line: NAME_OF_SCRIPT
- Second part: Short description of what the script does
- Third part: Author, date created, last date it was updated
- Separate the script into logical parts by making "breaks" with comment lines
- You can never be too descriptive!
In-Class Assignment
At the end of 2008, Yellowstone National Park experienced an increase in seismic activity in the Yellowstone Lake area.
We will take a look at this swarm of earthquakes, as well as others that have been recorded since 1973.
You can find out more about this swarm here.
For this assignment, you will need to download the text file that includes the earthquake data from here.
The columns in the text file are as followed:
YEAR YYYYMMDDHHMMSS.SS LATITUDE LONGITUDE DEPTH MAGNITUDE
By the end of class today:
- Write a script to import the data, and produce the following 2 plots
- Plot earthquakes as points, with Latitude on the vertical axis and Longitude on the horizontal axis
- Plot a histogram of number of earthquakes per year
- You will need to show Matt or Kevin your plots before you leave today
Assignment 3
You will build a web page for this assignment attach a link to it from your "Assignments" page.
Your site should contain:
- Map of earthquake locations (your latitude vs. longitude plot)
- Histogram of number of earthquakes per year
- A link to your M-file (Matlab script) used to make these plots
- Commentary on observations using these plots. Describe any spatial or temporal patterns you see in the data and comment on what it might mean in terms of processes operating under the volcano.
Grading Rubric:
- Web page for the assignment--5 points
- Earthquake location plot--10 points
- Histogram plot--10 points
- Matlab m-file (including comments)--15 points
- Commentary--10 points
Assignment is due Tuesday, February 10, 2009.
GLG410/598 Computers in Earth and Space Exploration
Last modified: February 4, 2009