Lecture 21 (cont.): Digitizing the geologic map of Dreamy Draw, Phoenix Mtns.
Today we will describe how to digitize a simple geologic map. When you digitize a geologic map, you should try to use
all the data available to you to make the map as good and correct as possible. These data include mapping in the field, air photos (e.g. Phoenix_2004), as well as digital elevation models (DEM's). As a starter we provide the
air photo as well as a generic map that our heroic TA made. Although she did a decent(?!) job, it is by no means absolute truth! First and
foremost you should believe in your own abilities and mapping skills. You might consider this generic map as a guide which knows the
way to 75% or so... It is up to you to make a more accurate map, based on the various data available to you.
Download these files, put them into a new folder and unzip them. Open ArcMap, create a new map and Add Data.
First you will add the georeferenced basemap (20566312.tif). By doing so you will make sure that the map actually has
a coordinate system. Then you can add the scanned map. You will get the warning message that these raster data
have no spatial reference -press ok. The first thing you have to do before you can start digitizing the map is
to rectifiy the scanned map. We have discussed this in class before. Here is the link if you want to freshen up
on how to do it:
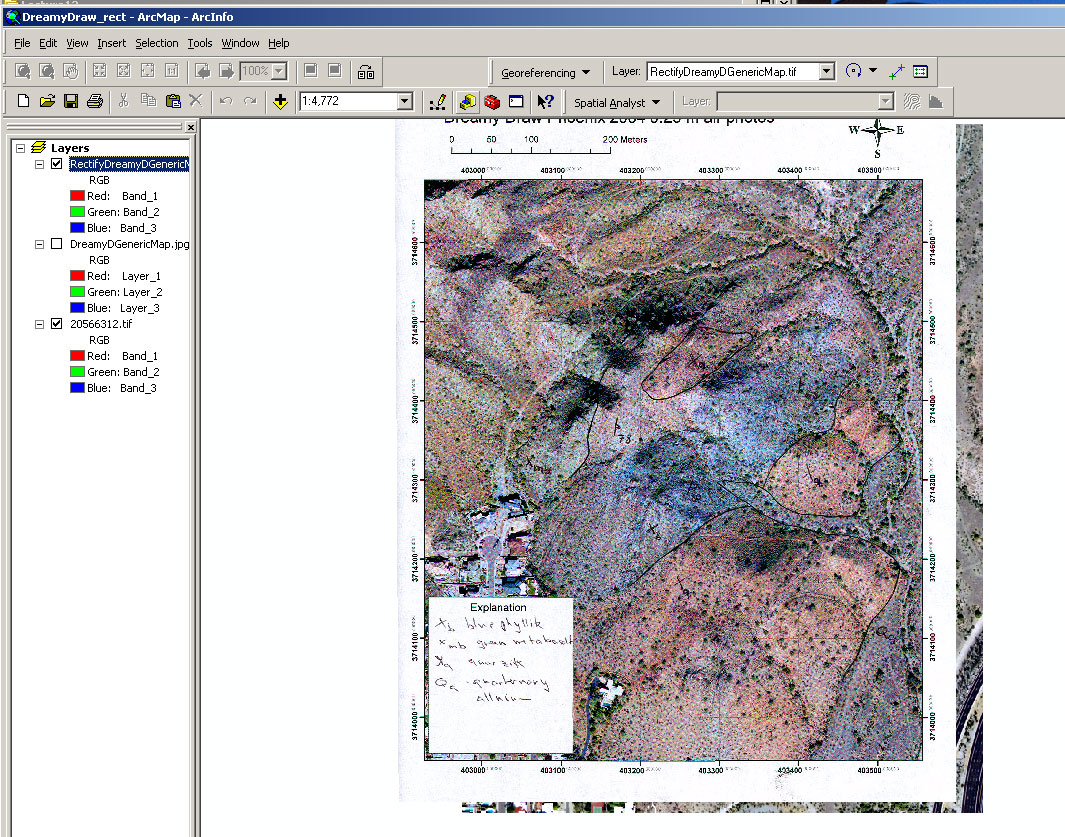
Now you have the referenced map, looking something like this.
In order to digitize contacts and geologic units you have to create
new shape files. We discussed this as well before. Here is the corresponding link explaining how to create and
edit shape files in great detail:
Create a polyline shape file for the contacts, and a polygon shape file for the units. You can give each
shape file as many attributes as you think is necessary, but you certainly should add a field called "certainty"
in the "contacts" shape file, and a field called "unit" in the "units" shape file.
Video explanation:
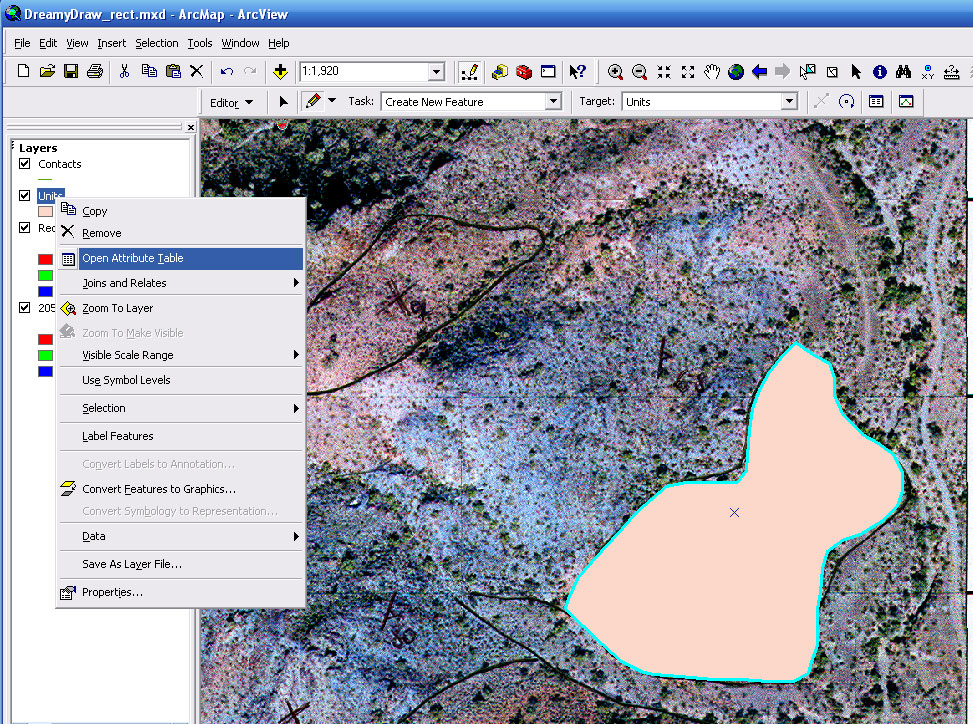
Now I can start to create the shapes. I will be starting with a unit => start editing and select "Units" as target.
Then select the sketch tool and start clicking away... after you have outlined the unit (have drawn the polygon
you can right-click the mouse and select "finish sketch" in the appearing menu. You will see the polygon being
filled with some color -which you can change, as always, when you go to layer properties => symbology.
For now,
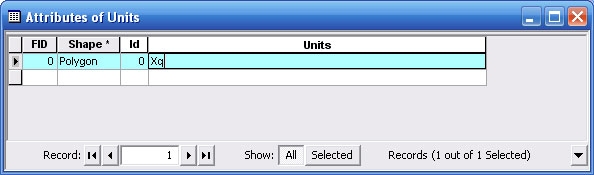
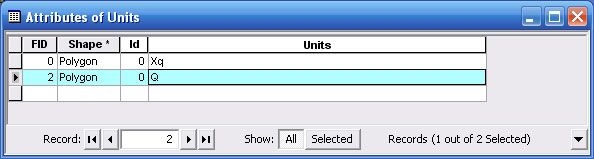
we don't change to color but make an entry in the attribute table to give it the unit name (in my case it is the Xq, the Precambrian quartzite). Later we will use that field/attribute to color-code the map. For that, we have to
be careful to write the same unit always the same way!! dont mix 'xq', 'xQ', 'XQ' with 'Xq'
Video explanation:
Digitize the next unit. There are more sophisticated ways to do this, but for now we will only show the easiest
way to do it. If units share a boundary (the polygons touch each other) just click along the boundary.
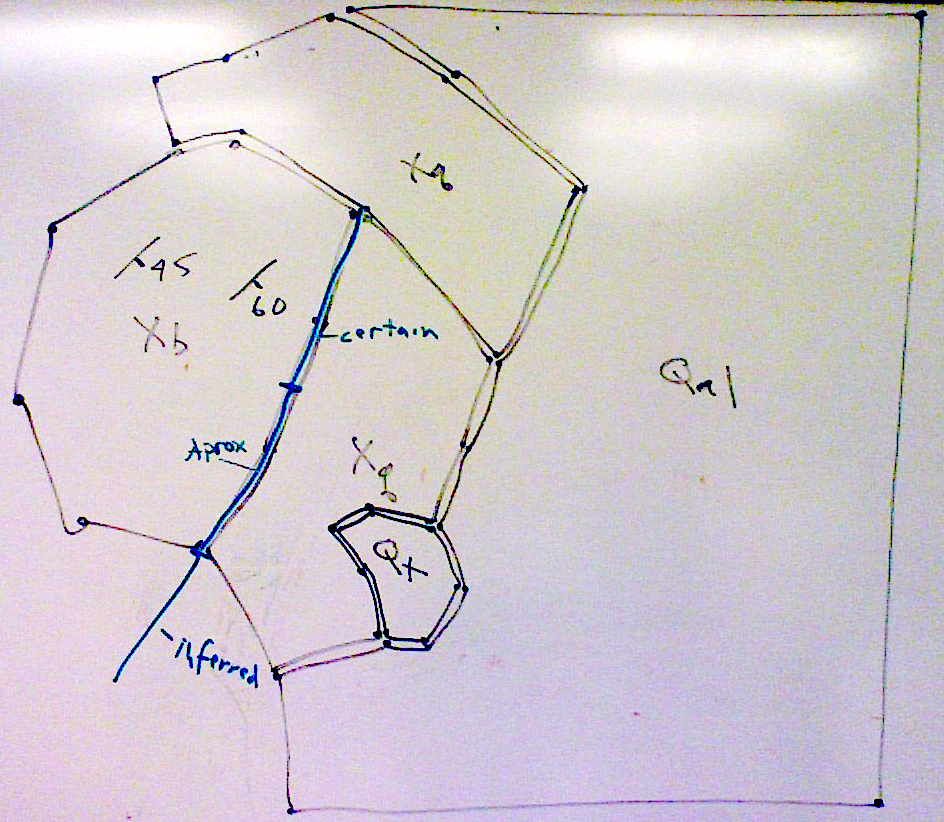
Here is a sketch of the details of having the polygons adjacent to eachother and their contact overlain by the contact line. It exemplifies this idea. Just draw two separate polygons with points close together when they touch.
Video explanation:
Here is what I did for the second unit (Q, the Quaternary deposits). Notice that Arc gave it the same color as Xq -
it doesn't know that these are two separate units. Next thing we do is entering the unit name again, as before:
open attribute table and enter the name (Q).
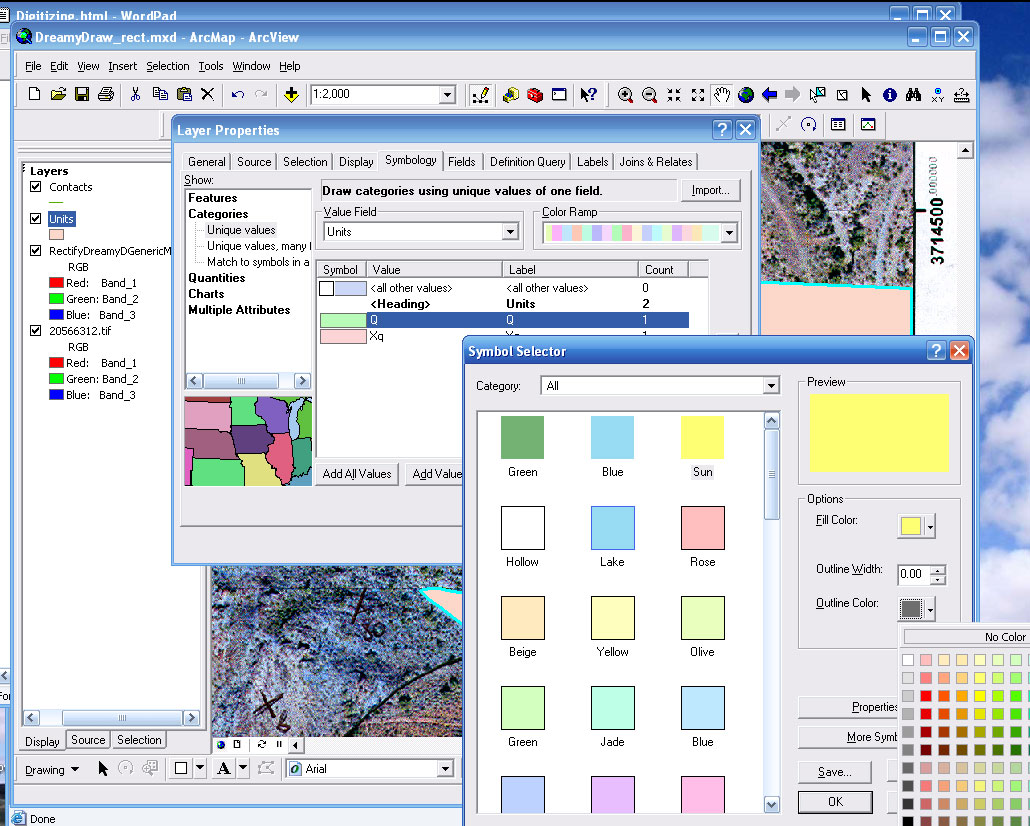
Now I want to give each unit a different color. Go to layer properties, symbology, change from features to
categories and select unique values. Change the Value field to Units and add all values. You should see
something like this. Right now, Arc made the unit Q green and Xq pink. I want to change the colors of the units
as well as the color of the outline. Double-click on the colorbar left of the unit name( e.g. Q). The
symbol selector will open where you can change the color of outline and fill -I choose a yellow fill and now
outline color. The Xq kept its color but the outline was turned to 'no color' as well.
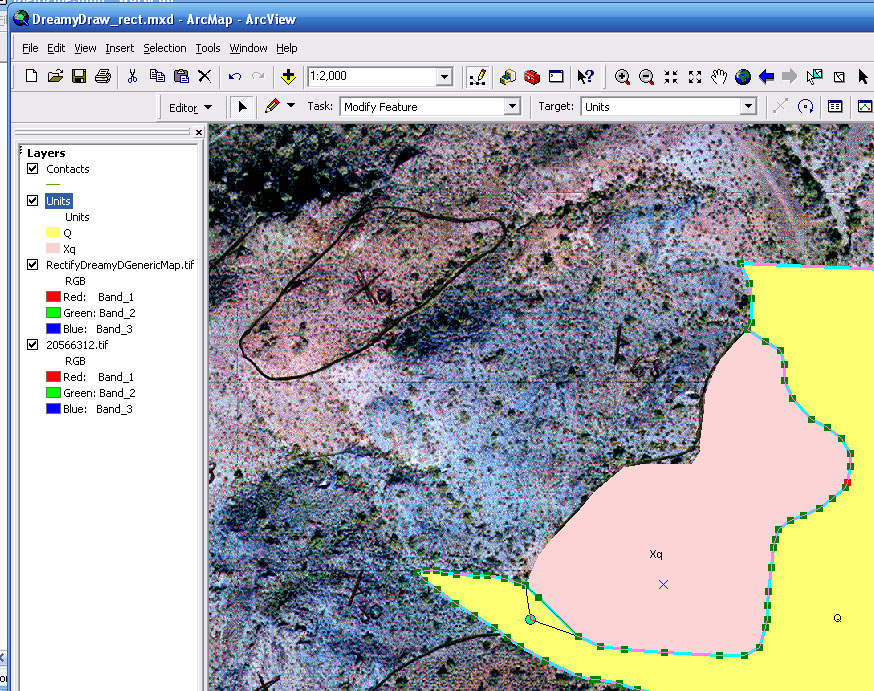
It is likely that you don't really
like your drawing right away but would like to move some of the vertices. You can do that by selecting the edit tool,left of
the sketch tool. Double-click the shape you want to edit and you will see that the vertices appear again. Move the cursor above the
vertex you want to move (the cursor will change, showing arrows in 4 directions). Now left-click, hold and drag to the new location.
Video explanation:
That's awesome. Next thing we do is drawing the contacts (=> change target in editor to 'contacts').
You have done this before. In the attribute table
we will write down how certain we are about a specific contact (could be 'certain', 'uncertain', 'inferred',
'queried'). If a contact changes 'certainty', you just divide the line, i.e. stop one line (of one certainty)
and start drawing a new line (that has the other certainty).
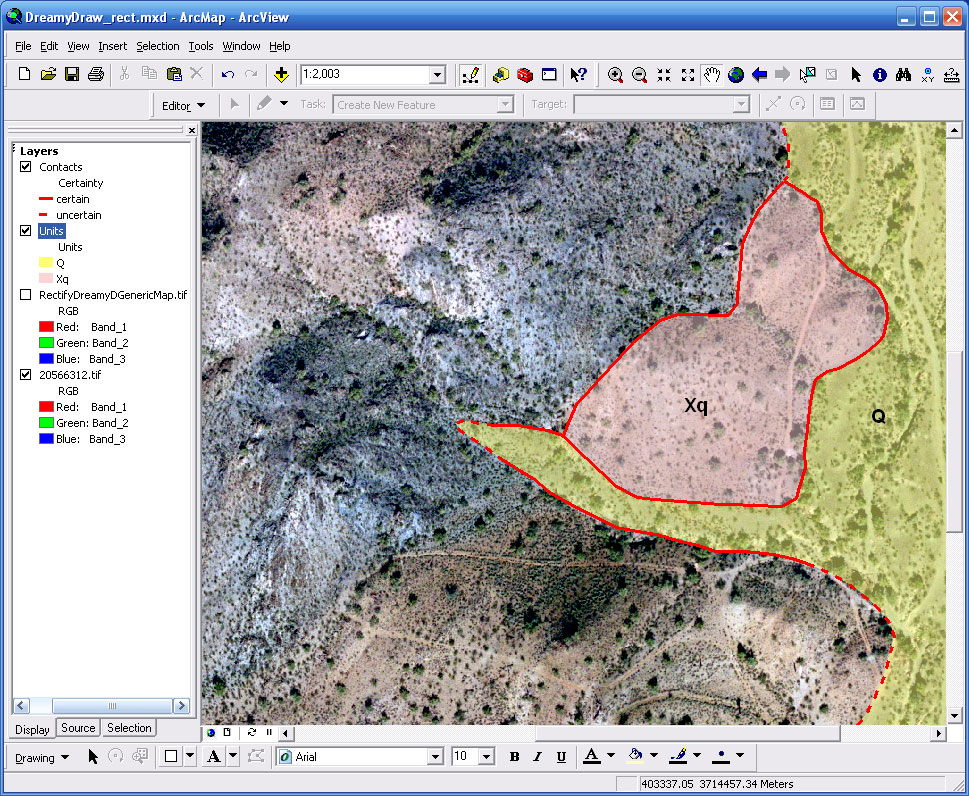
When you have drawn the contacts and noted the certainty in the attribute table,
you can -following the approach used for the units- change their symbology ('certain' contacts get
a thick line, 'uncertain' contacts a dashed line,and so forth). I did this, made them red, turned off the
layer that contains the scanned map and changed the transparency of the 'Units' to 50%.
Video explanation:
Your map should be something like that. Don't forget to enter the strike and dip as well
For this assignment, you are to follow the demonstrations from this lecture and the prior one and produce a complete geologic map for the Dreamy Draw area using the strike and dips and the geologic mapping that were provided along with your own judgements about contacts and geology as drawn from the base imagery that we provided. You should cover the entire area of the field map that was provided. You should use appropriate snapping methodology and include a units as well as contacts shape file. You will turn in the geologic map as a PDF exported from ArcMap with the units semitransparent over the aerial photography and it should include a scale bar, a north arrow and a simple legend/explanation. Provide also your MXD file and your two shape files in a zipped bundle along with the PDF to your Assignments page. This assignment is due on November 17, 2011 before class.
Last modified: November 10, 2011