GLG410/598--Computers in Earth and Space Exploration
Lecture 20: Combining analysis of rasters and vectors: application to landscape reconstruction
You have now learned the basics of creating and working with both rasters and vectors in ArcMap. In this exercise, I want to give you a chance to work with some vector and raster data to get experience converting between them and then using the raster calculator to query the raster to extract the parts that satisfy your constraints.
To learn about this, we will apply the processing to reconstructing a piece of landscape that was once more continuous, but a river system incised. We might want to know how much material was eroded in an area, and how the erosion varied over the area.
First, a little background
Many rivers are bounded by their former floodplains which have been abandoned as the river has cut down due to climatically, tectonically, or internally driven processes. These former floodplains become relatively flat surfaces called "terraces" which are separated from eachother by step slopes called "risers." In the case of the Salt River here in the Valley of the Sun, the terraces were studied extensively by former ASU professor Troy L. Péwé and his students. Jessica Block worked on the terraces as part of her M.S. thesis, finishing in 2007.
Have a look at figures 6 and 7 in this field trip guide: Urbanization, landscape, and geologic history along the Salt River (24.5 Mb pdf file)
.
In the examples for our class, we are going to reconstruct the Mesa terrace landscape and compute how much erosion has occurred since that time.
Step 1: gather the data
I have organized everything for you here: Salt_Verde.zip. Just download it, uncompress, launch ArcMap, and then open the Salt_Verde.mxd project file.
Step 2: Rectify the terrace map and then digitize the terrace outlines as a polygon shapefile
I have done this for you. You would follow Georeferencing raster data in ArcMap to do the rectification and Digitizing the geologic map in ArcMap to do it yourself.
Step 3: Extract the portions of the elevation data which are underlain by the Mesa Terrace
Do this from in ArcToolbox: Spatial Analyst->Extraction->Extract by Mask.
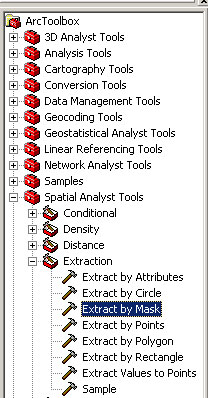 Specify the input surface (original DEM), the mask (the shapefile), and the output raster.
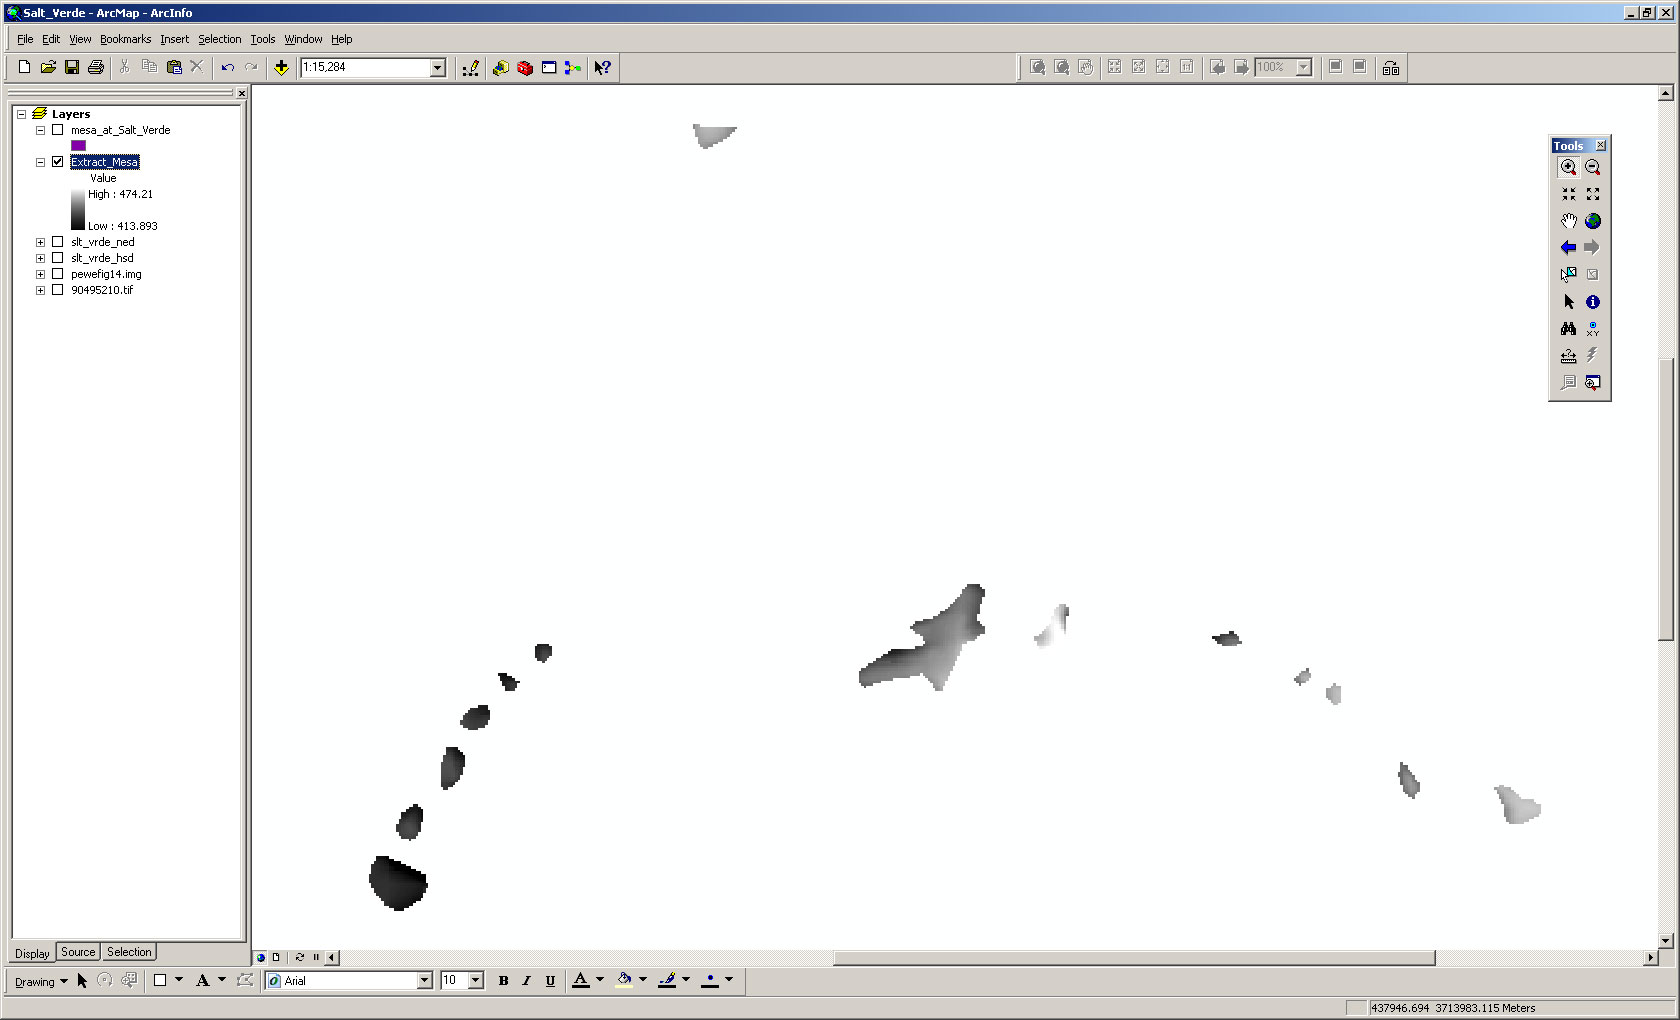
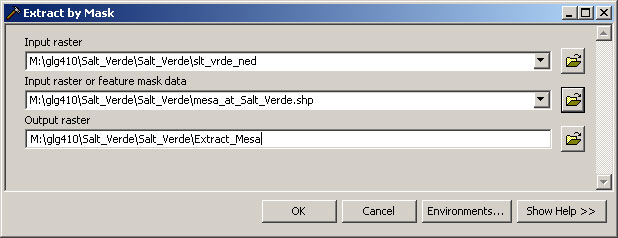 You will get a raster that has the elevation values under the Mesa terrace remnants and then NoData in the other cells.
Step 4: Convert the raster into a point shapefile with grid node elevations as attributes
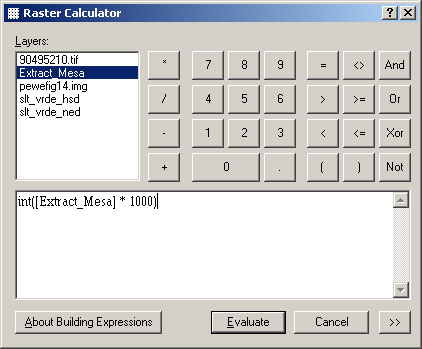
Unfortunately, Arc cannot convert a floating point grid to a shapefile with the grid node values as attributes. As a work around, we can make the grid into an integer grid. And, we can multiply the elevations by 1000, so it is in millimeters above sea level. This will maintain sufficient precision. We just have to remember later to convert it back to meters by dividing through by 1000. The result will be a new grid called Calculation.
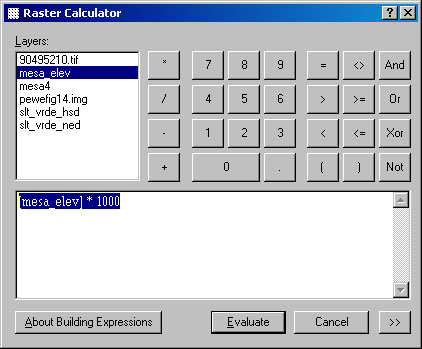
First convert to an integer grid multiplied by 1000 using the Raster Calculator in Spatial Analyst:
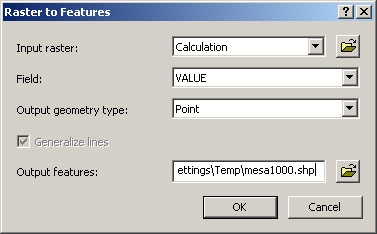
 Now, Convert raster to Features using 3D Analyst:
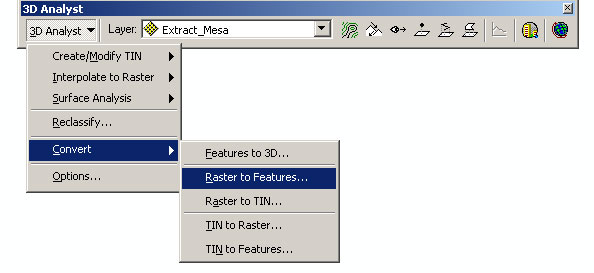 You want to make sure the Input Raster is the integer grid multiplied by 1000 which you just made. The Output geometry type should be Point. You can change the output feature name to something more meaningful than the default.
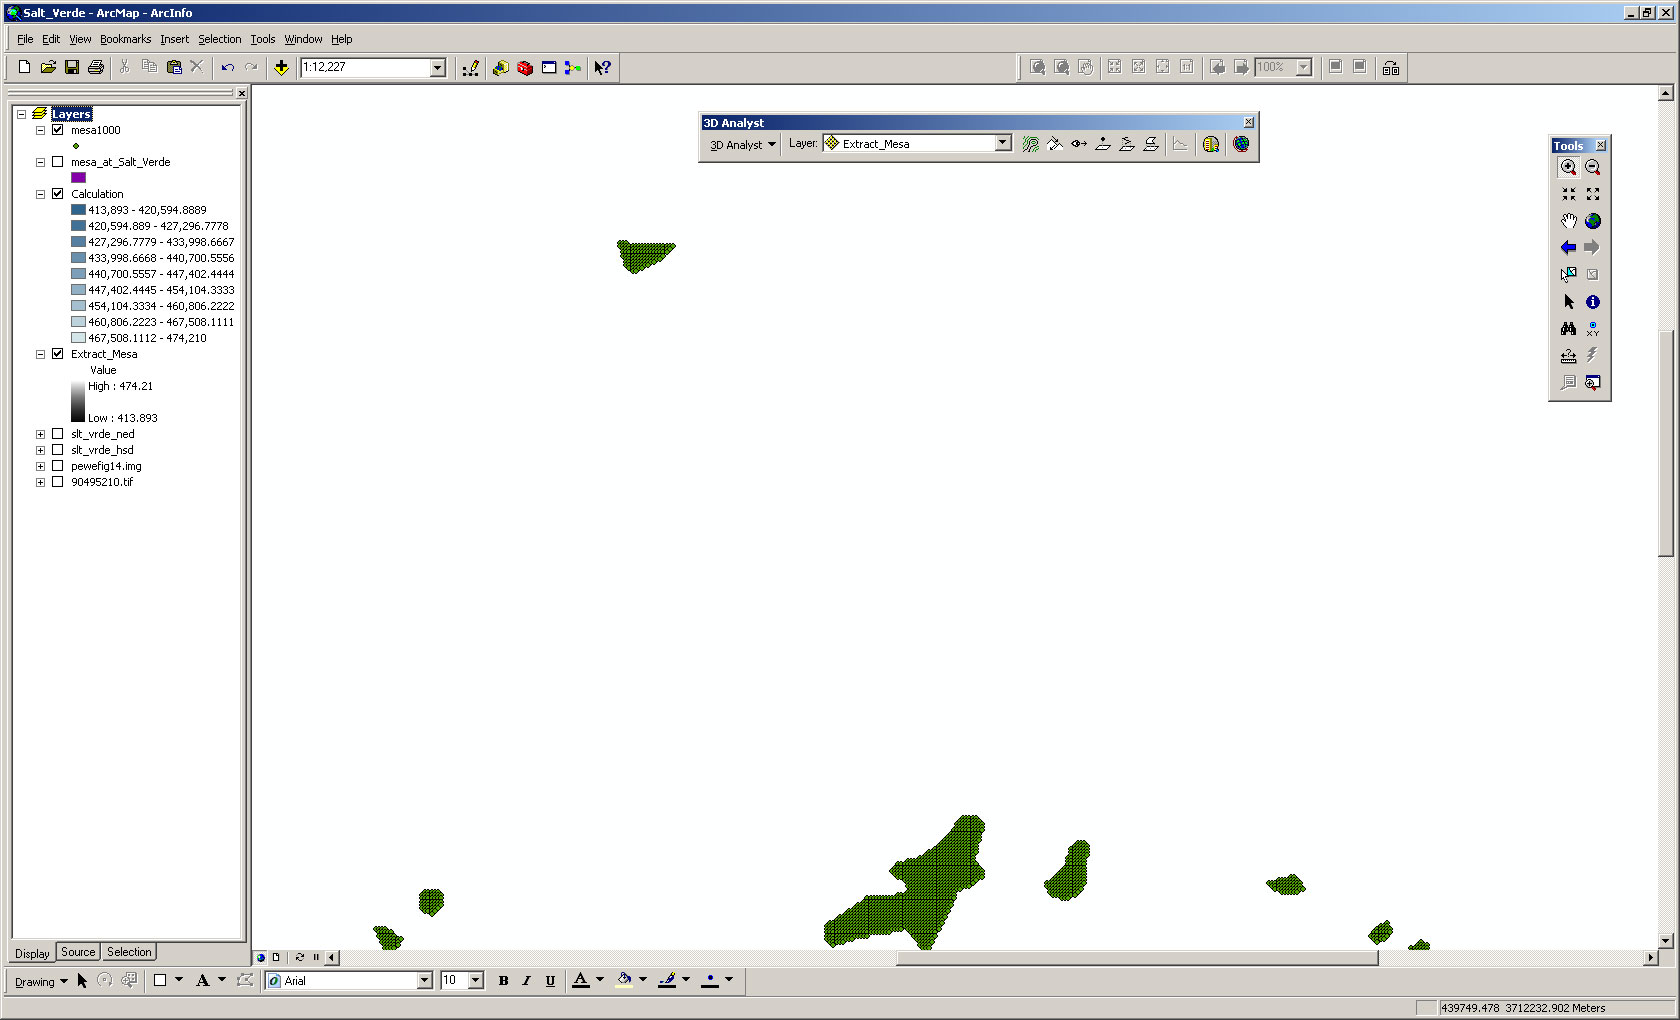
 Now you have a shapefile with a point at each grid node and the attributes are those elevations in millimeters as integers...
 Note that at the bottom of the lecture is a more complicated but slightly interesting alternative for the last step.
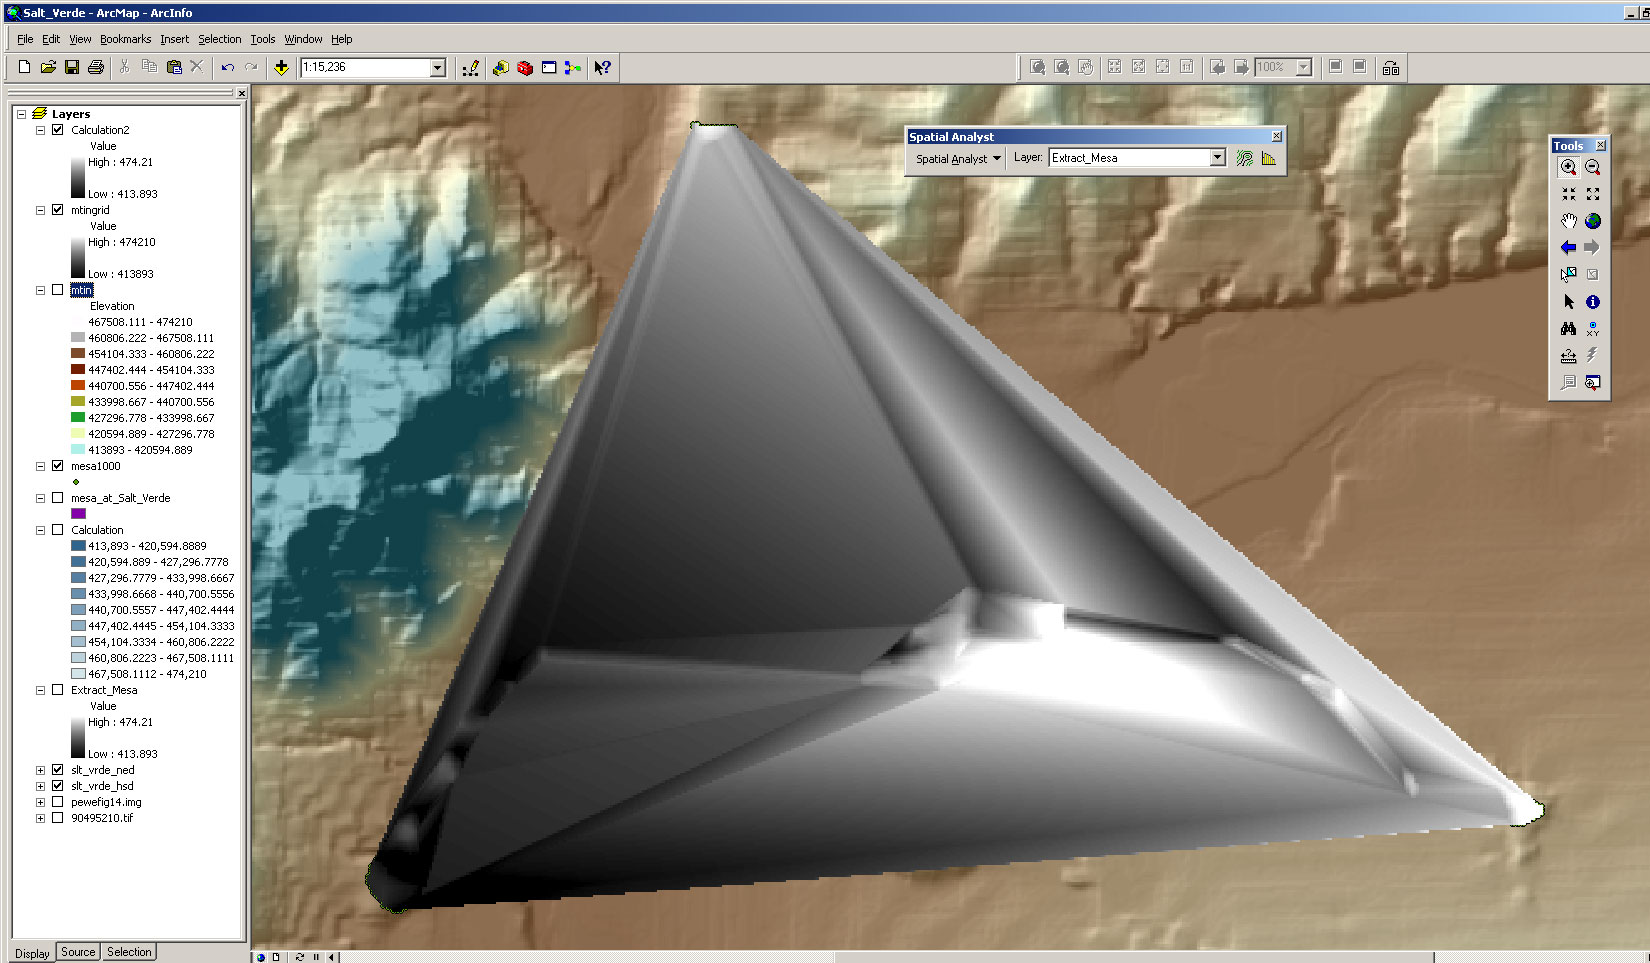
Step 5: Extrapolate between the remnants to reconstruct the surface
This is the trickiest part. There might be a better way to do this, but this is how I do it.
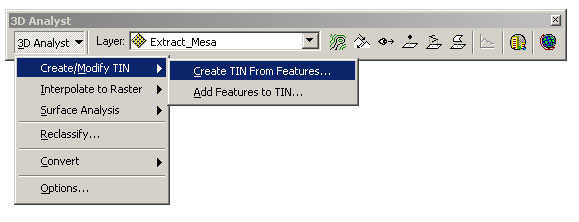
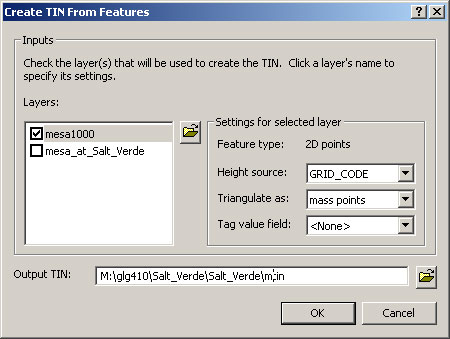
- Make a triangular irregular network across all of those points (which were the nodes of the DEM). Basically this is a linear interpolation and so it assumes that the landscape was relatively flat in that area prior to erosion. Do this in 3D Analyst. Note that you need choose the correct shapefile and make sure you change the height source to GRID_CODE.
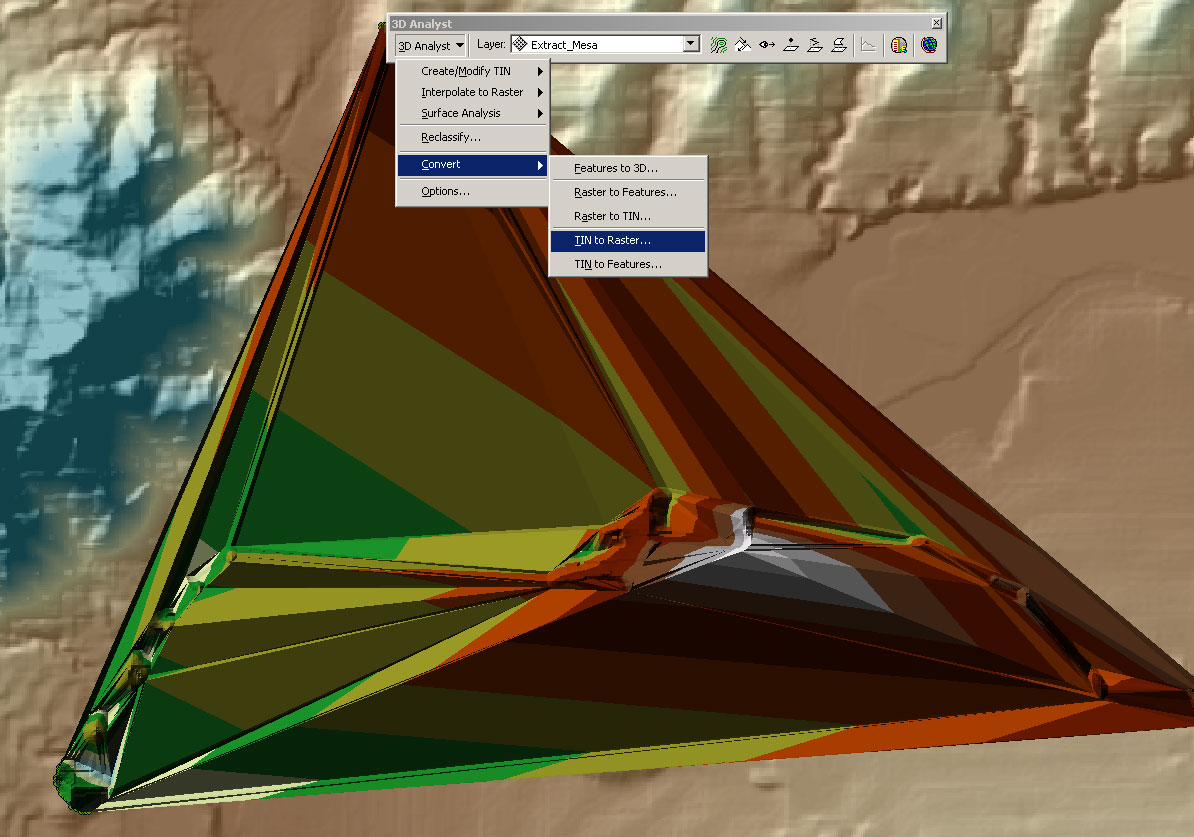
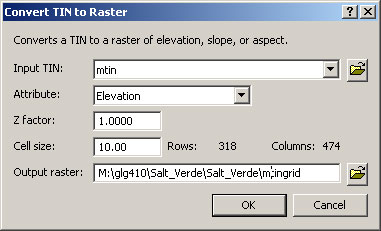
- Convert the resulting TIN to a Raster (Convert Feature to Raster). Do this in 3D Analyst. Note that I changed the output grid size to 10 m.

Step 6: Subtract the current topography from the reconstructed topography to get the amount of erosion
This is the fun part.
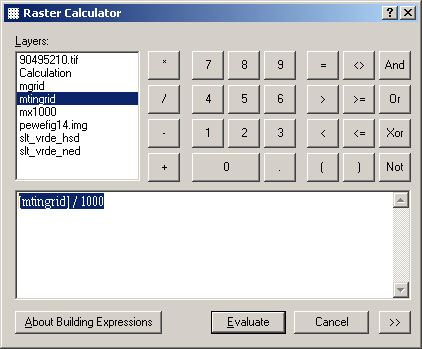
Don't forget that the elevations are still in millimeters, so divide the resulting grid by 1000: [mtingrid] / 1000
 Note that sometimes Arc won't be happy with all of this, and you might have to build each step separately, making the resulting grids permanent and each time launching a new ArcMap project.
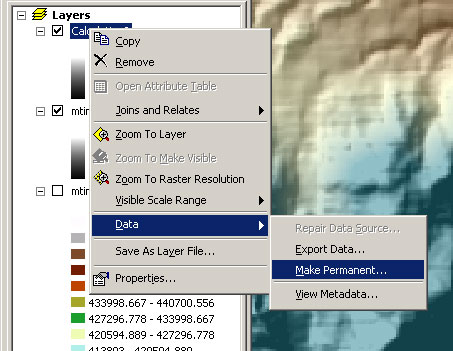
Make the resulting calculation permanent by right clicking on it and choosing Data->Make Permanent. Make sure you add it into the Project.
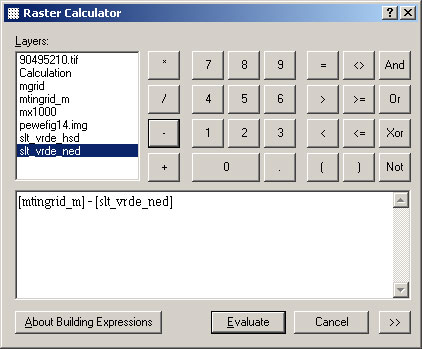
Using raster calculator, simply subtract the current topography from the reconstructed topography (end result of extrapolation part above). The resulting map is the erosion at each point since Mesa Terrace time. Do this in the Raster Calculator: [mtingrid_m] - [slt_vrde_ned]. Note that I made the file permanent and called it erosion
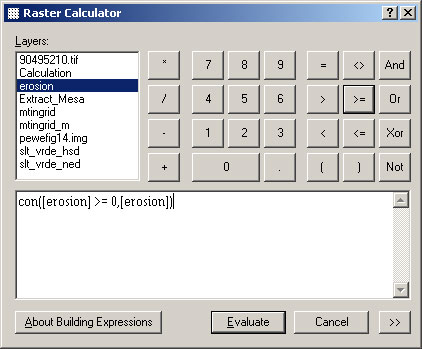
You will find that the result has a lot of negative values which are places where the current topography is above our interpolated surface and so not reasonable. In the raster calculator, you want to use the Conditional command. It has the structure of con(if true, do this). Look at the ESRI explanation: CON. This is a very powerful capability of Raster Calculator. Use the Raster Calculator once more to just give you the positive erosion: con([erosion] >= 0, [erosion]): Everywhere that [erosion] >= 0 is true, give back the value of the erosion grid and make the other values NoDATA.
Here is the result: Salt_Verde_erode.pdf
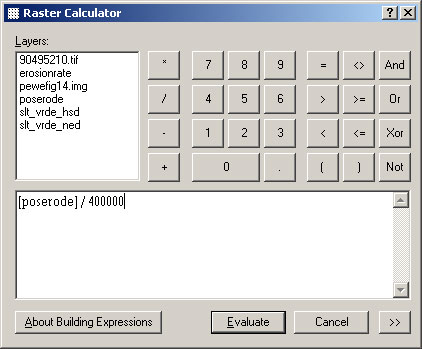
If the Mesa Terrace is 400,000 years old, compute the erosion rate by dividing the erosion by the years (again in raster calculator): [poserode] / 400000
Here is the result: Salt_Verde_erode_rate.pdf
Alternative way of doing the elevation extraction (uses CON way more):
Convert the vector geologic map to a raster
We need to get the vector geologic map into a raster with the same geometric properties as the DEM so we can do the processing that will follow.
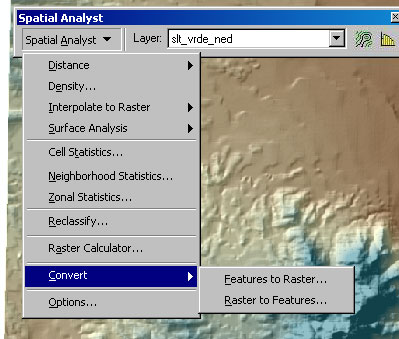
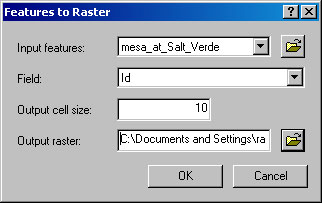
You will need Spatial Analyst (View->Toolbars). Then Spatial Analyst->Convert Features to Raster
Extract the elevations of the raster that correspond to the geologic units
We need to extract the elevations of the remnant surfaces of the Mesa terrace (basically the pieces of the raster that are mapped as Mesa). You will need to use the Raster Calculator in Spatial Analyst.
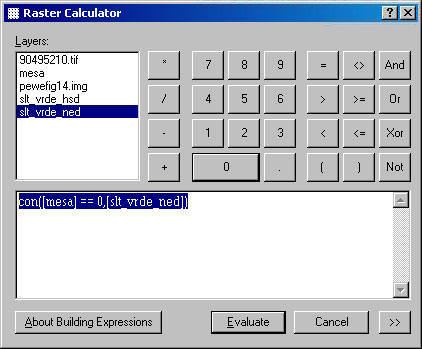
In the raster calculator, you want to use the Conditional command. It has the structure of con(if true, do this). Look at the ESRI explanation: CON.
In the Rater Calculator type: con([mesa] == 0,[slt_vrde_ned]). Note that it has to be exact!! so click on the different pieces in the Raster Calculator if possible. Y
In a rather annoying step, you have to make the resulting grid an integer grid. But, we don't want to lose the parts of the numbers to the right of the meter decimal place, so first multiply the elevations by 1000 in Raster Calculator: [mesa_elev] * 1000.
Because ArcMap may crash at this time, after each step, make that output permanent:
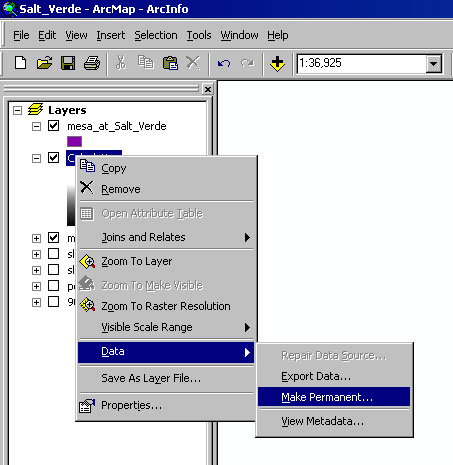
Add the permanent file into the project.
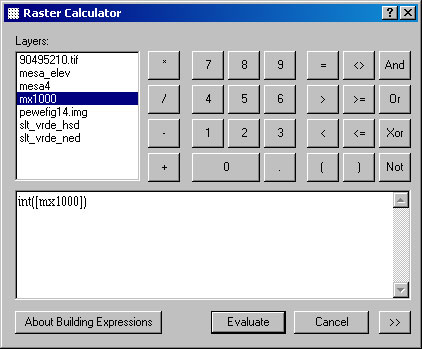
Then, convert the calculation to an integer:int([mx1000])
Because ArcMap may crash at this time, after each step, make that output permanent:
Add the permanent file into the project.
Last modified: April 21, 2009