GLG410/598--Computers in Geology
GLG410 Excel warm up exercise (3)
The data below are taken from the topography at a site along the San Andreas Fault in California.
Here is a few picture:

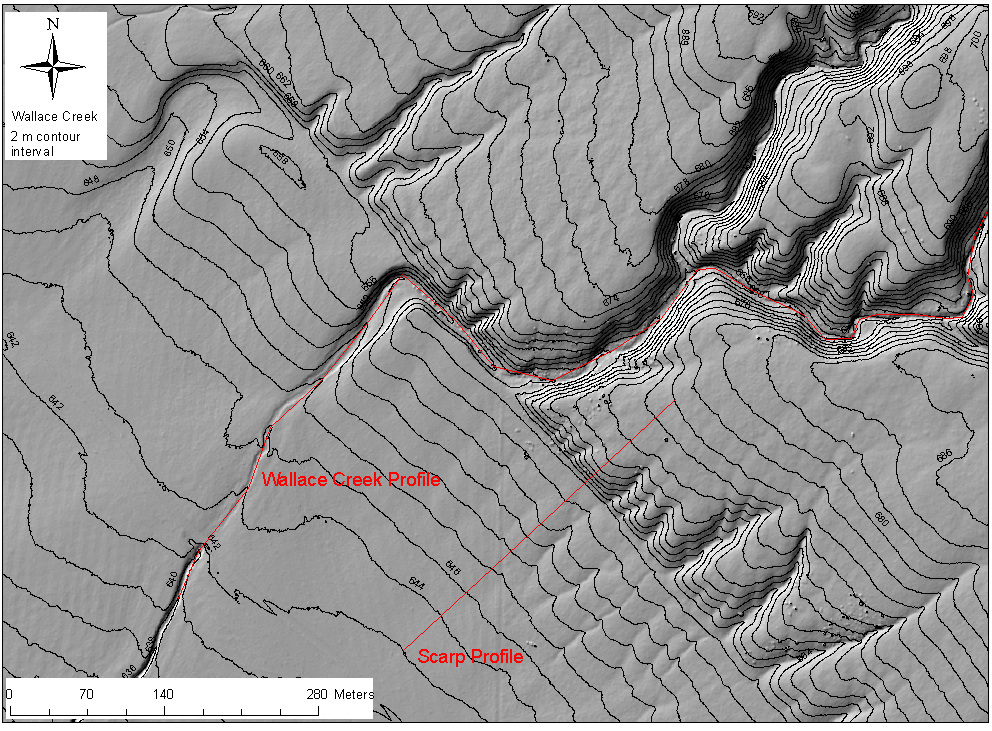
Stream offsets at Wallace Creek, Carrizo Plain, California
View northeast across the San Andreas fault showing several offset stream channels. Main channel is offset about 130 m and was incised approximately 3,700 years ago. Channel farther to left on near side of fault has been displaced approximately 350 m, is beheaded, and was incised approximately 10,000 years ago. These offsets and ages provide a long term slip rate of approximately 35 mm/yr along the San Andreas fault here (Sieh and Jahns, 1984). Small gulches at right display about 9 m offset from the 1857 earthquake.
Tasks
- Using the spreadsheet of the topography every 5 meters at Wallace Creek (WallaceCreek.xls), make two plots: The first is a contour plot (Chart Wizard->Surface), and the second is a 3D view (Chart Wizard-Surface). Make sure that both plots are well labeled and that they have annotation (drawing and text that points out the San Andreas Fault). Make sure also that the view direction for the 3D view is useful and shows the features well. Turn this in as a separate spreadsheet from below.
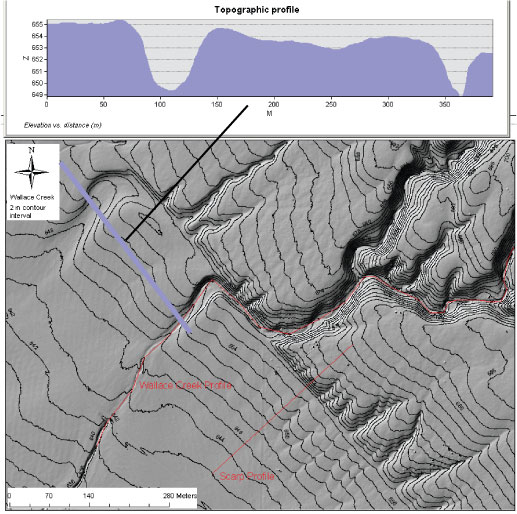
- Looking at the map I have provided (wc.gif or wc.pdf, please make two topographic profiles along the two red lines I have drawn ("Scarp profile" and "Wallace Creek profile") using a ruler and Excel. ( I did one in this figure to show you what it could look like: SampleProfile.jpg.) Steps to do this:
- A topographic profile is simply a plot of "rise over run." It is a plot of the elevation versus distance along the profile (from one end or the other). The profile can be straight or curving, it does not matter, but the distance is along the profile line.
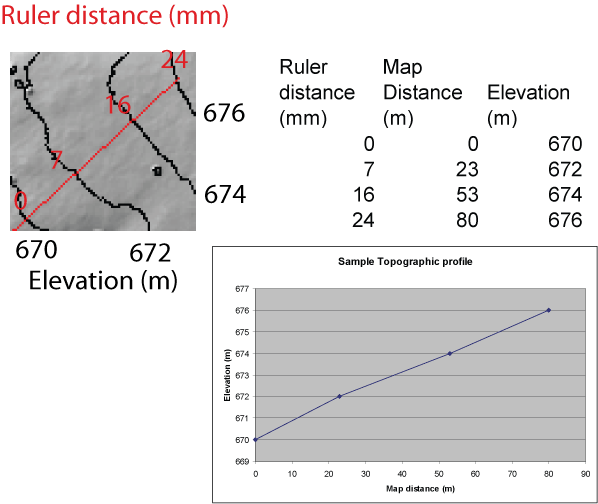
- Make a column in your spreadsheet of "ruler distance" and measure from one end of the profile to each successive intersection with contour. In the next column, write the elevation.
- Using the map scale, convert the "ruler distance" to "map distance (meters)"
- Here is a little graphic showing how a piece of the map and spreadsheet might look: profile.gif
- Plot the map distance on the x axis and the elevations on the y axis. Label and annotate the plot. Where does the profile cross the fault (in the case of the Wallace Creek profile, it is a zone along your profile)?
- Answer in the spreadsheet: What is the overall shape of each profile? Why should one be different than the other (besides the fact that they go over different places (what kind of landforms are along each profile?)? What affect if any does the fault have on the profile?
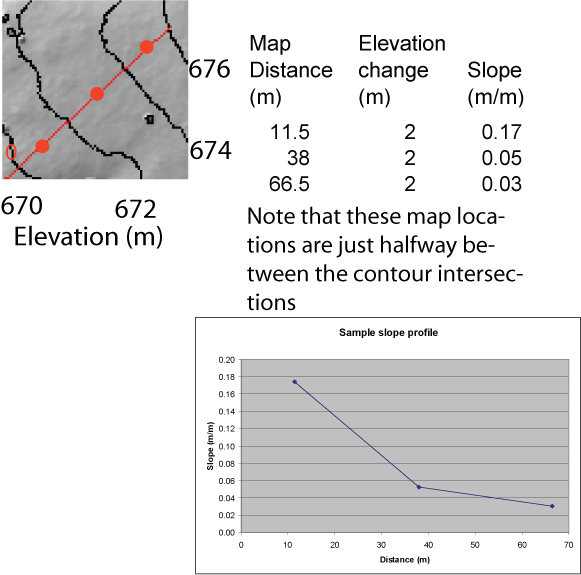
- Compute the slope along the profile: To do this, you want to know the "rise over run" for each segment of your profile. Do do it, you need to compute the height difference between each successive point and divide by the distance between the two points. Then, you need to plot it half way between each of the two points. This picture shows how it might look: slope.gif. Note that there will be one shorter slope calculation points than the original profile points. Plot the slope versus the map distance (now for the midpoints). What are the ranges of slope? Where is the biggest change in slope? Why?
GLG410/598 Computers in Geology
Last modified: September 7, 2007