GLG410--Computers in Earth and Space Exploration


Announcements Syllabus Schedule Weekly lecture notes Assignments Links

Matlab scripting and simple data analysis

Introduction

In this lecture, we will learn to create Matlab scripts ("M-files") that allow use to run a series of commands in a much quicker and easier way. We will then use this new tool to demonstrate how we can take a set of data from an input file, import that data into Matlab, have Matlab plot the data, and finally save it as a JPEG image, all in "one motion".

Matlab Scripting

The advantage of "scripting" vs. "command line" is that you can give Matlab hundreds to thousands of commands by just typing the name of your saved script. Scripting in Matlab is done by using the Matlab Editor. The Editor is Matlab's built-in text editor. You will type the same kinds of commands that we have been typing on the command line. You will want to keep one command per line! You will also want to remember to end each line with a semicolon to suppress the output. Matlab scripts are also called "M-files". This is because they have the ".m" ending. Matlab will recognize ALL files with ".m" as scripts to run commands.

To open the Editor window, click the icon at the top of the Matlab GUI , or type edit. We can type the last commands from Lecture 3 into the Editor. We want to load the input file into Matlab, plot the river discharge data, add a title and axis labels, and then save the figure to a JPEG.


Save the script to an M-file. We can call this script daily_discharge.m. To run this script, type daily_discharge at the prompt in the Command Window.

Commenting

The above script is functional, but if we were to pass this off to another person, it would take them some time to figure out what the script does if they run it. This is where commenting comes in VERY handy. To place comments within a script that you write, you will use the percent sign, %. All text in that line after % will turn green and will be a comment.

Here is that same script, but now it is properly commented.


Kevin's Tips For Proper Commenting Video explanation of scripting


The following two demos use the command line to illustrate the commands, but you should build these in scripts.
These examples use seismicity data from Bolivia. Here is the file for you to practice: seisformatlab.txt. The columns are: Date Latitude Longitude Depth Magnitude.

Video explanation of how to load data and make a map


Video explanation of how to load data and make a histogram


Assignment: Analysis of Oklahoma Seismicity data

Over the last 5 years or so, the practice of wastewater injection in Oklahoma apparently has driven a great increase in seismicity. have a look at this link for some more information: Oklahoma earthquake information.

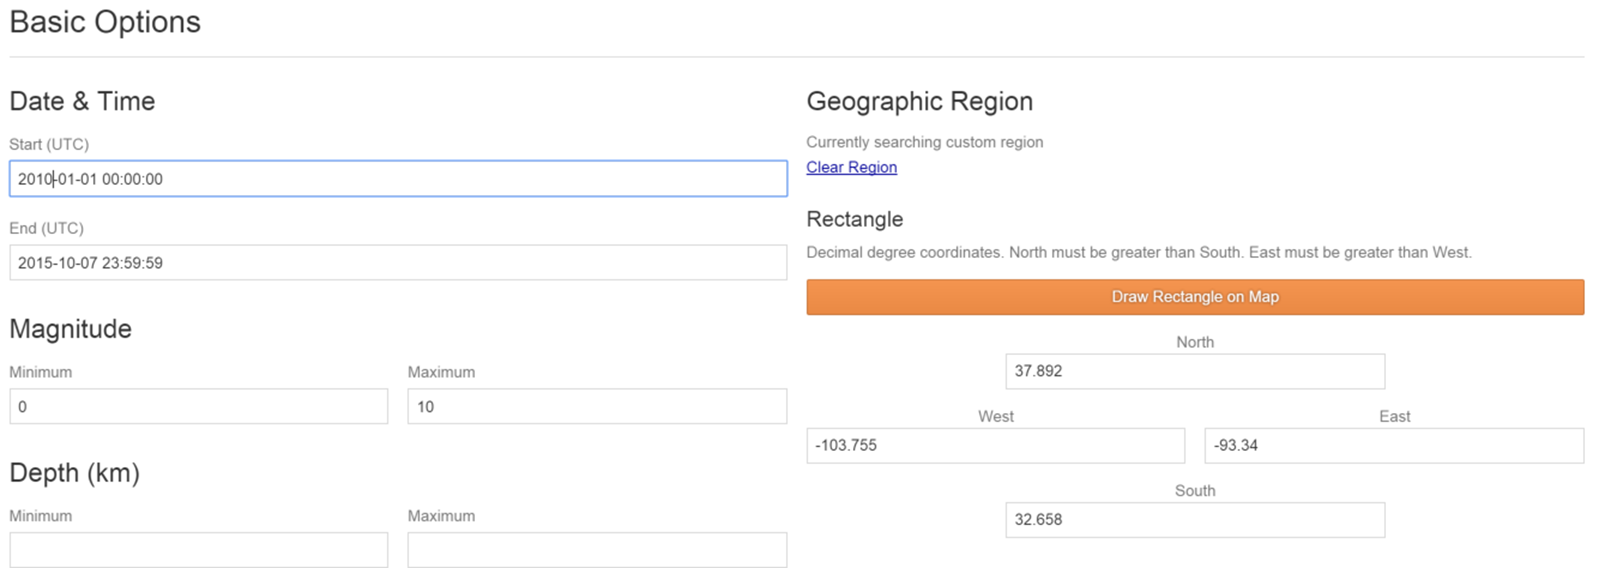
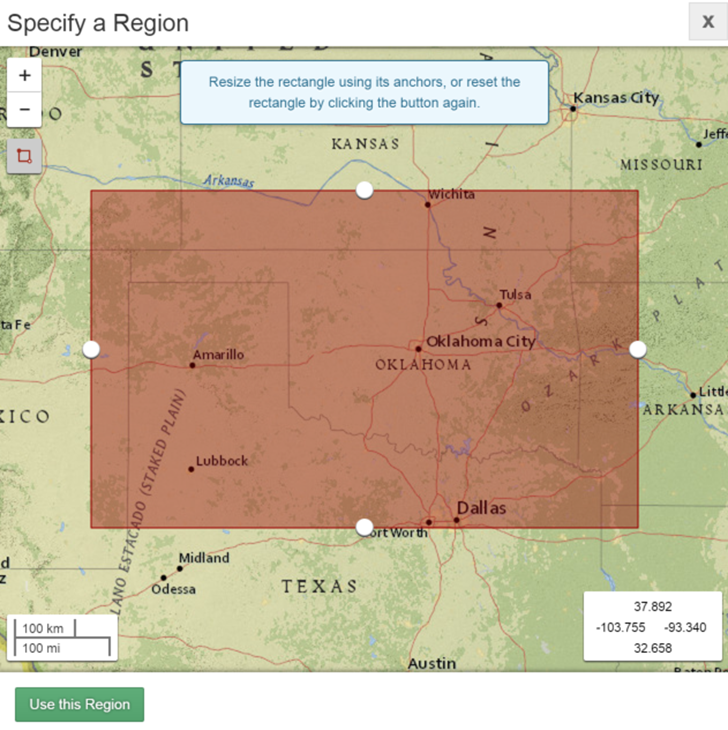
I have downloaded a list of earthquakes for you (and cleaned them up a bit for efficiency) for Oklahoma from the beginning of 2010 to the end of September 2015. They came from this composite earthquake catalog for the US. Here is a screen capture of the web interface and here is a map.

For this assignment, you will need to download the text file of the earthquake data here.

The columns in the text file are these:
year month day latitude longitude depth magnitude

Main tasks:

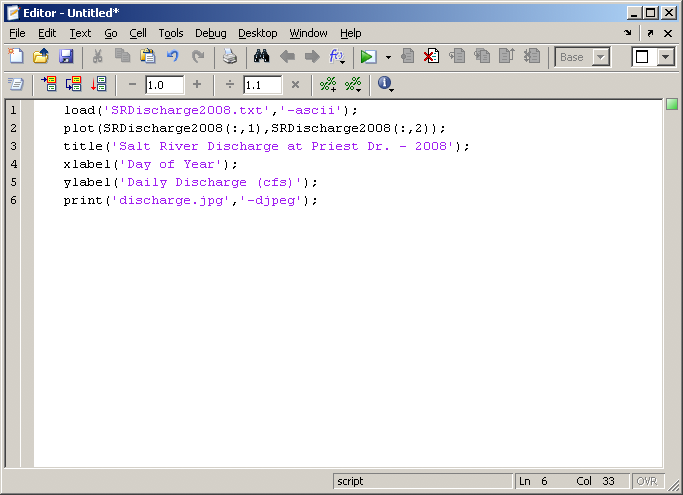
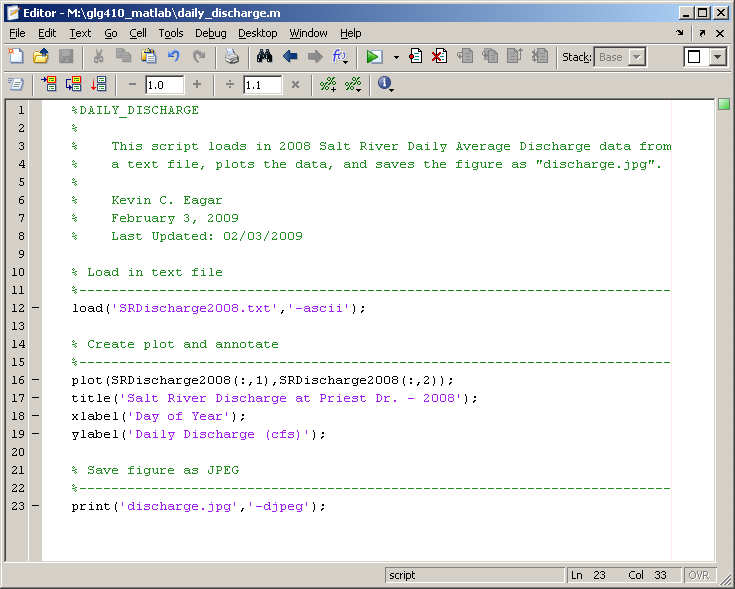
  1. Write a script to import the data
  2. Using a map of the US, pick out 5-10 lat long vertices along the outline of the state of Oklahoma and plot them as a line plot(lat,long, 'k-'), etc. on the following two plots (note that you may want to repeat the first and last point so that the polygon will close).
  3. Plot earthquakes as points, with Latitude on the vertical axis and Longitude on the horizontal axis
  4. Plot a histogram of number of earthquakes per decimal year (hints: a] decimal year = year + (month number/12) + (day number/365) and b] make a histogram with each year as a bin
You will build a web page for this assignment attach a link to it from your "Assignments" page. Your site should contain:
  1. Map of earthquake locations (your latitude vs. longitude plot)
  2. Histogram of number of earthquakes per year
  3. A link to your M-file (Matlab script) used to make these plots
  4. Commentary on observations using these plots. Describe any spatial or temporal patterns you see in the data and comment on what it might mean in terms of evolving processes associated with earthquakes and injection in Oklahoma. How have the statistics (min, mean, max) of the magnitudes and depths, varied over time?
Grading Rubric: Assignment is due Wednesday, October 14, 2015 by the beginning of class.

GLG410 Computers in Earth and Space Exploration


Last modified: October 7, 2015